Curated OER
Usage and Interpretation of Graphs
Students explore graphing. In this graphing lesson, students predict how many shoe eyelets are present in the classroom. Students count eyelets and work in groups to organize and chart the data collected. Students put all the data...
Curated OER
Introduction to Representing and Analyzing Data
Represent data graphically. Allow your class to explore different methods of representing data. They create foldables, sing songs, and play a dice game to reinforce the measures of central tendency.
EngageNY
Representations of a Line
Explore how to graph lines from different pieces of information. Scholars learn to graph linear functions when given an equation, given two points that satisfy the function, and when given the initial value and rate of change. They solve...
Curated OER
What's in a Graph?
How many yellow Skittles® come in a fun-size package? Use candy color data to construct a bar graph and a pie chart. Pupils analyze bar graphs of real-life data on the Texas and Massachusetts populations. As an assessment at the end...
Curated OER
Interpreting Data and Statistics using Graphs
Seventh graders interpret data. In this lesson on types of graphs, 7th graders construct, interpret, and analyze different graphs. This lesson includes worksheets and resources.
Curated OER
The Number Line
Learners graph and order numbers using a number line. They also solve word problems using fractions and decimals and rewrite equations to solve problems correctly. Several example word problems are given.
NTTI
Line 'Em Up!
Coordinate planes and Cartesian graphing systems are the focus of this math lesson. Learners use video, internet activities, and engage in hands-on activities in order to explore coordinate planes. The materials needed for this lesson...
EngageNY
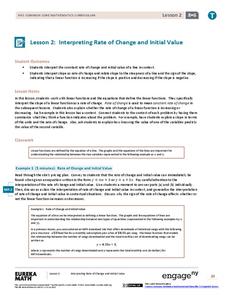
Interpreting Rate of Change and Initial Value
Building on knowledge from the previous lesson, the second lesson in this unit teaches scholars to identify and interpret rate of change and initial value of a linear function in context. They investigate how slope expresses the...
EngageNY
Two Graphing Stories
Can you graph your story? Keep your classes interested by challenging them to graph a scenario and interpret the meaning of an intersection. Be sure they paty attention to the detail of a graph, including intercepts, slope,...
Mathematics Assessment Project
Comparing Lines and Linear Equations
Scholars first complete an assessment task on writing linear equations to model and solve a problem on a running race. They then take part in a card matching activity where they match equations and graphs of lines to diagrams of fluid...
NASA
The Big Climate Change Experiment Lesson 3: Climate Change Lines of Evidence
Consider the preponderance of evidence when making a verdict. The third of five lessons in Unit 1: The Big Climate Change Experiment focuses on the evidence for climate change. Learners study graphs, diagrams, and pictures regarding...
Curated OER
Interpreting and Displaying Sets of Data
Students explore the concept of interpreting data. In this interpreting data instructional activity, students make a line plot of themselves according to the number of cubes they can hold in their hand. Students create their own data to...
Curated OER
The Hudson's Ups and Downs
Fifth graders practice interpreting line graphs of the Hudson River water levels to assess the tides and tidal cycles in the estuary. They explore how weather can affect water levels and tides and observe that high tides and low tides...
Curated OER
Real Misleading Graphs
Learners identify real graphs and misleading graphs. In this algebra lesson plan, students surf the Internet for real life scenarios where graphs are used in a misleading way as well as in a correct way.
EngageNY
Graphs of Piecewise Linear Functions
Everybody loves video day! Grab your class's attention with this well-designed and engaging resource about graphing. The video introduces a scenario that will be graphed with a piecewise function, then makes a connection to domain...
Pennsylvania Department of Education
Equal Groups
Students explore statistics by completing a graphing activity. In this data analysis activity, students define a list of mathematical vocabulary terms before unpacking a box of raisins. Students utilize the raisins to plot data on a line...
Curated OER
Line & Scatter (What Would You Use: Part 2)
Young scholars discuss line graphs and scatter plots and the best situations in which to use them. Using the graphs, they determine the type of correlation between variables on a scatterplot. They create a scatterplot and line graph...
EngageNY
Increasing and Decreasing Functions 1
Model situations with graphs. In the fourth installment of a 16-part module, scholars learn to qualitatively analyze graphs of piecewise linear functions in context. They learn to sketch graphs for different situations.
EngageNY
Solution Sets to Inequalities with Two Variables
What better way to learn graphing inequalities than through discovering your own method! Class members use a discovery approach to finding solutions to inequalities by following steps that lead them through the process and...
Curated OER
Wind Effects- A Case Study
Students explore hurricanes. In this weather data interpretation lesson, students draw conclusions about the impact of Hurricane Floyd as it related to weather conditions. Students read and interpret a tide data table, a barometric...
Curated OER
Spaghetti Graphs
Students work in pairs to test the strength of spaghetti strands. They collect and graph data to determine a line of best fit. Students create a linear equation to interpret their data. Based on the data collected, students predict...
Curated OER
Graphs and Data
Students investigate poverty using graphs. In this algebra lesson plan, students collect data on the effects of poverty and use different rules to analyze the data. They graph and use the trapezoid rule to interpret the data.
Curated OER
Matrix Analysis of Networks
Explore the connection between a finite graph, a directed graph, and a matrix. Graph lines and identify the relationship of matrices in real-world scenarios. Then use this information to work with a partner to plan and design a...
5280 Math
Integer Interpreter
Can you add variables if you don't know their value? Using an empty number line, scholars first locate the position of the difference, sum, product, and quotient of two unknown integers. Later problems mix operations as well as add...


