Curated OER
Graphing Systems of Inequalities
Solve equations and graph systems of inequalities. Designed as a lesson to reinforce these concepts, learners revisit shading and boundaries along with solving linear inequalities.
5280 Math
More or Less the Same
Tell the story of the math. Given a graph of a linear system, learners write a story that models the graph before crafting the corresponding functions. Graphs intersect at an estimated point, allowing for different variations in the...
National Security Agency
Systems of Equations and Inequalities
High school classes can use manipulatives too! Offer hands-on, interactive lessons that venture away from the typical day in your algebra class. Young mathematicians will be involved in collaborative learning, visual...
Balanced Assessment
Bagels or Donuts
Explore business problems through mathematical analysis. The task has individuals write and graph a linear system to determine the best business model. They use their models to answer a series of questions that help to make a conclusion.
Texas Instruments
TI-Nspire™ CAS
When it comes to rating educational calculators, this calculator is always near the top of this list. Now it's available as an app. There is a lot of calculator power wrapped up in this app. Not only is this a fully functioning...
Curated OER
What's The Point?
Young scholars solve word problems using the correct math symbols. In this algebra lesson, students use the TI calculator to graph their equation and analyze it. They find the line of regression and use to draw conclusion.
Curated OER
Real World Systems of Linear Equations
Students solve systems of equations with fluency. In this algebra lesson, students graph, use elimination and substitution to solve systems of equations. They identify the point of intersection using algebra.
Curated OER
Homecoming Tickets
Students solve word problems using systems of equation. In this algebra lesson plan, students use computer and graphing to graph and analyze their solution. They solve system involving inequalities.
Curated OER
Whose Line is it Anyway?
Students solve systems of equations. In this algebra lesson plan, students identify the domain and range of each function. They use the slope and y-intercept to graph each line.
Curated OER
Analyzing Graphs of Two Equations
Students analyze graphs of two equations. In this algebra lesson, students rewrite word problems as linear equations. They graph their solution and compare and contrast the two items being represented.
Curated OER
How Do They Relate? Linear Relationship
Students collect information and use a line to represent it. In this algebra lesson, students investigate real world data to see if it makes a line. They graph the line comparing the relationship of the x axis with that of the...
EngageNY
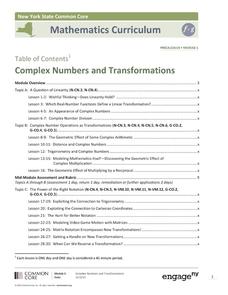
Complex Numbers and Transformations
Your learners combine their knowledge of real and imaginary numbers and matrices in an activity containing thirty lessons, two assessments (mid-module and end module), and their corresponding rubrics. Centered on complex numbers and...
Curated OER
PLANETS IN PROPORTION
Students discover scales for both the solar bodies' relative sizes and their distances from the sun. They find equatorial circumference and volumes of their solar bodies. Students apply estimation strategies and proportioanl reasoning to...
Curated OER
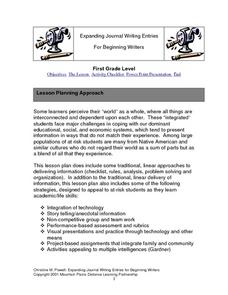
Expanding Journal Writing Entries For Beginning Writers
First graders through a variety of strategies assess how to write in journals openly and effectively. Those strategies include integration of technology, story telling, group and team work, performance-based assessment/rubrics, visual...
Curated OER
Alice Computer Programming
Students explore multimedia components. In this science inquiry lesson plan, students read "Invitation to the Game" by Monica Hughes and they use the Alice Computer Programming System to better understand population dynamics.
Curated OER
What Are The Chances
Students calculate the probability of an event occurring. In this probability lesson, students differentiate between independent, dependent or compound events. They find the range of the data.
Curated OER
Flow Rates of Faucets and Rivers
Students work together to discover the flow rates of faucets and rivers. They relate their results to engineering and applied science concepts. They make predictions on the flow rate of a nearby river in their local community.
Curated OER
Introduction to Parametric Equations
Pupils write and solve parametric equations. In this algebra lesson, students find and eliminate parameter of equations. They graph parametric equations and analyze the graphs.
Curated OER
Between The Extremes
Learners analyze graphs for specific properties. In this algebra lesson, students solve equations and graph using the TI calculator. They find the different changes that occur in each graph,including maximum and minimum.
Curated OER
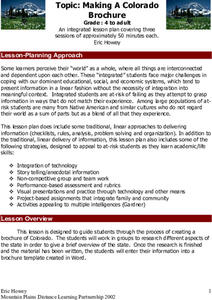
Making A Colorado Brochure
Students create a Colorado brochure. Given a variety of brochures, students explore the aspects of an attractive brochure. In groups, students explore tourist attractions, important people, major cities, and statistics of Colorado. ...


