EngageNY
Events and Venn Diagrams
Time for statistics and learning to overlap! Learners examine Venn Diagrams as a means to organize data. They then use the diagrams to calculate simple and compound probabilities.
Math Stars
Math Stars: a Problem-Solving Newsletter Grade 7
Put on your thinking caps because middle school math has never been more interesting in this huge resource full of thought provoking questions. Written as a newsletter, the resource has 10 two-page newsletters with a variety of...
Shodor Education Foundation
Algorithm Discovery with Venn Diagrams
Here is a lesson that takes an interesting approach to analyzing data using box and whisker plots. By using an applet that dynamically generates Venn diagrams, the class forms a strategy/algorithm for guessing the rule that fits the...
Shodor Education Foundation
Sets and the Venn Diagram (Beginner)
Venn diagrams are helpful in understanding the idea of a set and using attributes to sort items. This basic plan is an introduction with an added bonus of an applet that can be used to demonstrate the activity. If a classroom of...
Curated OER
Venn Diagrams
Students collect and display data in a Venn Diagram. In this statistics lesson, students collect data, compare the data and make inferences about their data. They use the Venn diagrams to identify what the data have in common and how...
Curated OER
Close Observation: Coins
Integrate math, science, and speaking/listening with a collaborative hands-on activity. Each group works with a single penny, examining it with the naked eye and recording observations. Repeat using magnifying glasses. Then repeat with a...
Curated OER
Sort It Out
Elementary schoolers engage in a game of logical reasoning called Secret Sort. A Venn diagram is used as a way to sort objects. This resource would be a great way to introduce the Venn diagram (maybe the most famous, and most-useful...
Curated OER
Sets an the Venn Diagram
Students explore the characteristics of sets and Venn Diagrams. Given data, students practice determining the placement of elements in a Venn Diagram. Students discuss the correspondence between data sets and their graphical...
Balanced Assessment
The Triskaidecaphobia Conference
Triskaidecaphobia is an extreme superstition to the number 13—and ironically the answer to the word problem is 13! Presented with a series of descriptive data, individuals analyze the data to determine the population size. They must...
Curated OER
Venn Diagram and UK Basketball
Students analyze data and make inferences. In this algebra activity, students collect and analyze data as they apply it to the real world.
Curated OER
Beautiful Bovine
Looking for a fun and interactive way to explore bovine biology? Learners read a brief informational text (included for printing) before participating in several cross-curricular activities. First, grab their attention with a hilarious...
Curated OER
Investigation: Sorting and Classifying
Fifth graders explore geometry by creating shapes with construction paper. For this shape characteristics lesson, 5th graders identify the different attributes that make up specific shapes and create them using construction paper,...
Berkshire Museum
Reduce, Reuse, and Recycle: Sorting Through Personal Choices
Raise children's awareness about the importance of conservation with this hands-on science instructional activity. Start by breaking the class into groups and having them collect trash from around the school or local park. Students then...
Curated OER
Mastering Math Vocabulary
Fifth graders investigate factors by utilizing mathematical terms. In this number sense lesson, 5th graders discuss and define terms such as factors, multiples, and denominators. Students create a Venn Diagram when completing common...
Curated OER
In the Loop
Students practice comparing items by using a Venn diagram. In this diagram instructional activity, students divide a group of similar buttons by the small details that separate them using a Venn Diagram. Students compare and contrast...
Curated OER
Geo Jammin'
Students compare and contrast related two- and three-dimensional shapes, and complete a Venn diagram illustrating the attributes of each. Using a poem pattern from another lesson, students use data from the diagram to write an attribute...
National Security Agency
Are You Game? A Lesson Connecting Fractions and Probability
Exactly how fair are the board games children grow up playing? Young mathematicians investigate this questions as they work their way through this five-lesson series on basic probability.
Curated OER
What is Soil?
Third graders examine what makes soil by creating a Venn Diagram. In this Earth environment lesson, 3rd graders identify the different components that soil is made from. Students bring soil from their homes to examine and create a Venn...
Curated OER
The Role of Fire in Healthy Prairie, Brush and Forest Lands
Sixth graders read and discuss background information and brainstorm reasons for wildfires. They use a Venn Diagram to list the similarities and differences between wildfires and prescribed fires and then track the weather forecast for...
Curated OER
The Energy that Keeps Us Moving
Learners measure the calorie content of food. In this technology lesson, students explore where the CEENBoTs get the energy to make it move. They create a Venn diagram showing the differences of energy in food and CEENBoTs.
Curated OER
Television: Comedy Vs. Drama
Students investigate the world of Television by contrasting specific programs. In this visual storytelling lesson, students compare and contrast the differences between comedy and drama by making a Venn Diagram. Students utilize the...
Curated OER
Analyzing Graphs and Data
Students collect and analyze data. In this statistics lesson, students graph their data and make inferences from the collected data. They display their data using graphs, bar graphs, circles graphs and Venn diagrams.
Curated OER
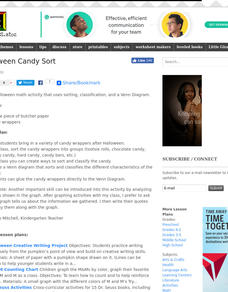
Halloween Candy Sort
Students use their Halloween candy to practice sorting and classifying. They compete a Venn diagram comparing their candy wrappers. They develop ways as a class to catorgize the candy in different ways.
Curated OER
Risk Taker - Probability Web Quest
Students complete an on line, teacher created, webquest to study the origin of probability, theoretical and simulated probability; computing the probability of two independent events; and mutually exclusive events. They make a Venn...
Other popular searches
- Venn Diagram Math
- Venn Diagram Math Worksheets
- Venn Diagrams Math
- Venn Diagrams in Math
- Graphing Math Venn Diagrams
- Sorting Math Venn Diagrams
- Venn Diagrams & Math
- Math Venn Diagrams Shape
- Venn Diagrams Math Fractions
- Sets Venn Diagrams Math
- Venn Diagram Math Drawing
- Math Venn Diagram Ms


