Chicago Botanic Garden
Historical Climate Cycles
What better way to make predictions about future weather and climate patterns than with actual climate data from the past? Young climatologists analyze data from 400,000 to 10,000 years ago to determine if climate has changed over...
Kenan Fellows
Reading Airline Maintenance Graphs
Airline mechanics must be precise, or the consequences could be deadly. Their target ranges alter with changes in temperature and pressure. When preparing an airplane for flight, you must read a maintenance graph. The second lesson of...
Howard Hughes Medical Institute
Seed Dispersal in Tropical Forests
How do seeds get around? It's not like plants can control seed dispersal—or can they? Dig deeper into the amazing mechanisms of seed dispersal observed in tropical plants through interactives, a video, and plenty of hands-on data...
Curated OER
What's in a Graph?
How many yellow Skittles® come in a fun-size package? Use candy color data to construct a bar graph and a pie chart. Pupils analyze bar graphs of real-life data on the Texas and Massachusetts populations. As an assessment at the end...
Curated OER
Solar Heating in the Himalayas
A fascinating lesson plan on how solar power is utilized by people who live in the Himalayas is here for you. In it, learners perform a case study which will help them understand that solar energy is a renewable resource, that geography...
Teach Engineering
Air Pollution in the Pacific Northwest
Scholars investigate levels of nitrogen dioxide in the Pacific Northwest by examining the role of nitrogen in air pollution and how remote sensing can be used to measure nitrogen levels. An Excel spreadsheet calculates the difference...
NASA
The Big Climate Change Experiment Lesson 3: Climate Change Lines of Evidence
Consider the preponderance of evidence when making a verdict. The third of five lessons in Unit 1: The Big Climate Change Experiment focuses on the evidence for climate change. Learners study graphs, diagrams, and pictures regarding...
Radford University
A Change in the Weather
Explore the power of mathematics through this two-week statistics unit. Pupils learn about several climate-related issues and complete surveys that communicate their perceptions. They graph both univariate and bivariate data and use...
Curated OER
Ornithology and Real World Science
Double click that mouse because you just found an amazing lesson! This cross-curricular Ornithology lesson incorporates literature, writing, reading informational text, data collection, scientific inquiry, Internet research, art, and...
Curated OER
Exploring Renewable Energy Through Graphs and Statistics
Ninth graders identify different sources of renewable and nonrenewable energy. In this math instructional activity, learners calculate their own carbon footprint based on the carbon dioxide they create daily. They use statistics to...
Mascil Project
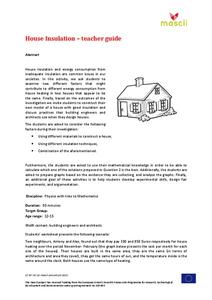
House Insulation
Make sure your house is warm in the winter. Pupils analyze graphs of heating costs for two similar houses and make hypotheses for why the costs differ. They then build models of houses with appropriate insulation to reduce heating costs.
Curated OER
Trends of Snow Cover and Temperature in Alaska
Students gather historical snow cover and temperature data from the MY NASA DATA Web site. They compare this data to data gathered using ground measurements from the ALISON Web site for Shageluk Lake. They graph both sets of data and...
Curated OER
Temperature and the Earth's Atmosphere
Earth science super stars visit the National Earth Science Teachers Association's interactive website to glean information on the layers of the atmosphere. Data tables are provided for them to record what is collected. This assignment...
Beyond Benign
Orb-It
How do the products you use rate on a greeness scale? Scholars use a tool to analyze shampoos and cars for their sustainability. They consider factors that affect the environment, the economy, and equity. This is the ninth lesson in...
Curated OER
Graphing Your Motion with Vernier LabQuests
Seventh graders create motion graphs using a motion sensor. In this physics lesson, 7th graders match the graph shown by moving their body. They relate the slope to the way they moved.
Curated OER
Applied Science - Science and Math Lab
Learners make a prediction. In this applied science lesson, students guess the number of items in a jar. Learners create a bar graph to show the predictions and the actual amounts.
Curated OER
The Parachute
Students discuss parachutes and write a procedure to determine the effect of different size parachutes and different masses on the time it takes the masses to fall. They record all their data from their experiment then write three...
Curated OER
Aerosol Lesson: Science - Graphing SAGE II Data
Students examine and plot atmospheric data on bar graphs.
Curated OER
Measuring Temperature and the Production of CO2 in Yeast
Students use a model experiment to complete an experiment on yeast. In groups, they identify the independent and dependent variables and use the scientific method to complete the activity. They record their observations and discuss them...
Curated OER
Water Chestnut Graphing Activity
Students are taught how to format and enter data into an Excel spreadsheet. They make a graph and interpret graphed data. Students discuss possible impacts of water chestnut invasion. They graph data on water chestnut. Students report...
Curated OER
Systems of Equations and Inequalities
This is a comprehensive lesson on creating and solving equations and systems of equations and inequalities. Problems range from basic linear equations to more complex systems of equations and inequalities based on a real-world examples....
Curated OER
Interpreting and Displaying Sets of Data
Students explore the concept of interpreting data. In this interpreting data instructional activity, students make a line plot of themselves according to the number of cubes they can hold in their hand. Students create their own data to...
Science 4 Inquiry
The Ups and Downs of Populations
Life has its ups and downs ... especially if you're an animal! Biology scholars engage in a population study through an inquiry-based lesson. Pupils work together to explore the factors that affect deer populations, then examine the...
Curated OER
A world of oil
Students practice in analyzing spatial data in maps and graphic presentations while studying the distribution of fossil fuel resources. They study, analyze, and map the distribution of fossil fuels on blank maps. Students discuss gas...


