Curated OER
Graphing Linear Equations with Two Variables
Can your class solve linear equations in two variables? They will be able to after they engage in this lesson. Individuals graph linear equations in two variables using slope and intercept and identifying the relationship between the x...
Curated OER
Monster Cars: Slope
Learners examine how a rate is calculated from two points. Using battery operated cars, pairs of students measure time and distance. Afterward, they use this data to calculate the rate. Learners then plot four ordered pairs and discover...
EngageNY
Two Graphing Stories
Can you graph your story? Keep your classes interested by challenging them to graph a scenario and interpret the meaning of an intersection. Be sure they paty attention to the detail of a graph, including intercepts, slope,...
Curated OER
Point-Slope Form of a Line
This activity helps young mathematicians connect the graph and the point-slope form of a line, by first solving a real-world problem and then using that example to motivate the understanding of the equation. By manipulating the gizmo,...
Curated OER
Slope-Intercept Form of a Line
Using the subscriber website Explorelearning.com, young mathematicians observe changes in the slope and y-intercept and their effect on the graph of lines. This activity helps learners develop an intuitive sense of the connection between...
Curated OER
Slope, Vectors, and Wind Pressure
A hands-on lesson using the TI-CBR Motion Detector to provide information to graph and analyze. The class uses this information to calculate the slope of motion graphs and differentiate scalar and vector quantities. There is a real-world...
Curated OER
Two Investigations of Cubic Functions
Through learning about cubic functions, students graph cubic functions on their calculator. Students determine the local maximum and minimum points and the tangent line from the x-intercept to a point on the cubic function. ...
Illustrative Mathematics
Telling a Story With Graphs
Turn your algebra learners into meteorologists. Students are given three graphs that contain information about the weather in Santa Rosa, California during the month of February, 2012. Graph one shows temperatures, graph two displays the...
Curated OER
Algebra 1: Slope as Rate
Students solve problems with slopes. In this algebra lesson, students identify the slope of a line and relate it to the rate of change. They graph their lines on the TI and observe changes in the lines.
Curated OER
Building Understanding of Rate of Change/Slopes Using Alice
Students explore slope as a rate of change. For this eighth grade mathematics lesson, students investigate real-world problems to determine rate of change and transform it into a linear representation, thus determining slope. Students...
Curated OER
Parabolas
Learn how to evaluate the derivatives of polynomials. Mathematicians find the derivative of a quadratic function and determine the value at a given value. Students compare the slope of the secant line through two points with...
Curated OER
Robo-Pull
Students solve linear equations using two steps. In this algebra lesson, students add, subtract, multiply and divide to solve linear equations. They apply concepts of equations to a robot pulling cargo.
Curated OER
A Steep Hike
Students explore slope. In this middle school mathematics lesson, students analyze and interpret graphs as they investigate slope as a rate of change. Students use a motion detector to collect data as they walk at different...
Curated OER
Slope and Topographic Maps
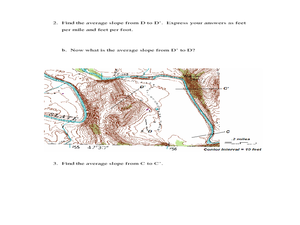
Students investigate slopes as they study topographic maps. In this algebra instructional activity, students discuss and apply the concept of slopes to graphing and analyzing data.
EngageNY
Making Scale Drawings Using the Parallel Method
How many ways can you create a dilation? Many! Individuals strengthen their understanding of dilations by using various methods to create them. The new technique builds on pupils' understanding of the ratio method. Using the ratio,...
Curated OER
Parametric Races & Slopes
Learners investigate the slopes and parametric equations. In this calculus lesson, students solve parametric equations with specific parameters. They relate lines and slopes based on the derivative of the equation.
EngageNY
Criterion for Perpendicularity
The Pythagorean Theorem is a geometry pupil's best friend! Learners explain the equation a1b1 + a2b2 = 0 for perpendicular segments using the Pythagorean Theorem. They are able to identify perpendicular segments using their...
Curated OER
Slippery Slope
Students define patterns, relation and function. In this algebra lesson, students find the slope of a line and write equations of line. They model the slope using real life scenarios.
Mathalicious
Domino Effect
Carryout the lesson to determine the cost of pizza toppings from a Domino's Pizza® website while creating a linear model. Learners look through real data—and even create their own pizza—to determine the cost of each topping. They...
Curated OER
Finding Slope of a Line
Learners calculate the slope of a line. In this algebra lesson, students graph a line using the slope and y-intercepts. They define the steepness of the line using the slope.
Curated OER
Cross Section and Slope
Students draw cross sections of given contour maps. In this math lesson, students interpret the different symbols used in the map. They determine slope and steepness through direct measurement.
Curated OER
Linear Modelling of the Life Expectancy of Canadians
Middle and high schoolers explore the concept of linear modelling. In this linear modelling lesson, pupils find the line of best fit for life expectancy data of Canadians. They compare life expectancies of men and women, and find...
Curated OER
Race The Rapper: Slopes
Learners calculate the slope of the equation In this algebra lesson, students graph coordinate pairs of linear equations and identify the relationship between x and y values and slope. They differentiate between functions and...
EngageNY
Vectors and the Equation of a Line
Represent linear equations in both two and three dimensions using parametric equations. Learners write parametric equations for linear equations in both two and three variables. They graph and convert the parametric equations to...


