Curated OER
Investigating: Interpreting Graphs and Analyzing Data
Students explore statistics by researching class birthday data. In this data analysis lesson, students investigate the different birthdays among their classmates and create data tables based on the given information. Students view bar...
Curated OER
Effects of chemical use in Agriculture
Pupils research environmental data to create a bar graph. For this agricultural ecology lesson, students research the pros and cons of chemical use in farming. Pupils debate on passing a law to reduce chemical use.
Curated OER
The Top Ten On-The-Job Skills and Attitudes
Students interview people who have a business and have people working for them. They create a bar graph with the results of their survey. They create a chart with the most important skills or attitudes looked for in a potential employee.
Curated OER
Historical Population Changes in the US
Students conduct research on historical population changes in the U.S. They conduct Internet research on the Historical Census Data Browser, create a bar graph and data table using a spreadsheet program, and display and interpret their...
Curated OER
How Tolerant Are Kids in Your School?
Students graph results of a survey about attitudes and tolerance in their school. They discuss the social climate of their school. Students complete a questionnaire, and tabulate the raw data from their class. They create a bar graph...
Curated OER
The Numbers Tell the Story
Students demonstrate how to gather and interpret statistical data. In this data analysis lesson plan, students search for statistics on the health effects of smoking and place the information into charts. Students create these charts...
Curated OER
Tables, Charts and Graphs
Students examine a science journal to develop an understanding of graphs in science. In this data analysis lesson, students read an article from the Natural Inquirer and discuss the meaning of the included graph. Students create a...
Curated OER
Jellybean Graphs
Second graders predict and graph data based on the color of jelly beans they think are in a handful. In this prediction lesson plan, 2nd graders will predict how many of each color jellybean are in a handful. Then they graph these...
Curated OER
An Immigration Graph
Students practice reading and understanding information in a table and converting the information to graph form. They create a graph showing the number of immigrants per country of origin between 1899 and 1924.
Radford University
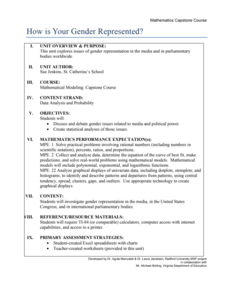
How Is Your Gender Represented?
Does the media shape people's views on gender? Scholars use data on gender portrayal in magazines to explore the idea. They use a spreadsheet program to create bar graphs and perform a chi-square test. They also use provided data to...
Curated OER
MAISA and the REMC Association of Michigan
Students complete online research to study geography's impact on weather. In this geography and weather lesson plan, students research weather in their city for ten days using an online website. Students bookmark the site, enter data...
Curated OER
Getting the Lead Out
The article for this lesson no longer accessible through the links in the lesson plan, but can be found in the National Center for Biotechnology Information website. After reading it, environmental science students answer questions and...
Curated OER
Graphing Data on Ellis Island
Third graders use data to make a bar graph. In this graphing and social studies lesson plan, 3rd graders use data about where Ellis Island immigrants came from to complete a bar graph on Microsoft Excel.
Curated OER
Using Excel To Teach Probability And Graphing
Students engage in the use of technology to investigate the mathematical concepts of probability and graphing. They use the skills of predicting an outcome to come up with reasonable possibilities. Students also practice using a...
Curated OER
Foliage Tracker
Young scholars discuss the change of leaf colors and the role that climate and elevation play in those changes. They then track leaf changes, input data, and graph foliage changes with a free online tool.
Curated OER
Graphing the Past Using Today's Technology
Eighth graders research statistical data regarding their current social studies unit. They write questions about the measures of central tendency, collect and analyze the data, insert the data into a spreadsheet, and generate graphs.
Curated OER
Rain Forests: A Disappearing Act?
Students examine and locate rainforests on maps, and research the patterns of their destruction. They develop a bar graph of rainfall and temperature data, write a journal entry, and research the people, animals, and plants/products of...
Curated OER
Name Count and Graph
Students find the frequency of a name in selected states by using the Internet. They input data into a spread sheet. They create a graph that illustrates the gathered information.
Curated OER
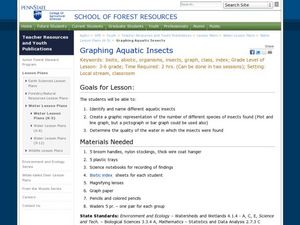
Graphing Aquatic Insects
Students identify aquatic insects. In this organism instructional activity, students locate aquatic insects near a local waterway and collect them. Students graph the amount of insects that they collected.
Curated OER
Bird Bulletins
Students, in groups, create a survey to investigate how much their community knows about birds. They graph their findings using a bar graph. Using the data collected, they develop an advertising campaign to increase community awareness...
Curated OER
A Class Census
Students recognize that data represents specific pieces of information about real-world activities, such as the census. In this census lesson, students take a class and school-wide census and construct tally charts and bar graphs to...
Curated OER
Civil War and Reconstruction
Students examine the differences between the North and South during the pre-Civil War era. In this Civil War era lesson plan, students spent 7 days looking at things that were different between the Union and Confederate state before the...
Curated OER
Tracking Olympic Gold!
Learners use print or online resources to track the results of the Olympic Games, record daily results on graphs, use graphs to collect information.
Curated OER
Involving Community Members, Parents, and Community Agencies in Student Learning
Students predict and estimate the number of moose shot by people between the years of 1986-1990. They analyze data and statistics, construct bar graphs, and conduct research on the Alaskan moose.
Other popular searches
- Skittles Bar Graph
- Double Bar Graphs
- Bar Graphs Pictographs
- Histogram and Bar Graph
- Bar Graphs and Histograms
- Bar Graph Problem Solving
- Favorite Food Bar Graph
- Bar Graphs Histograms
- Interpreting Bar Graphs
- Bar Graphs for Birthdays
- Bar Graph Worksheet
- Bar Graphs and Charts


