Curated OER
Time Management: Piece of Pie
Students examine their own lives and how well they manage their time outside of school. In this this time management lesson, students discover the amount of time they spend on other activities, and create a pie chart with that...
Curated OER
Students Favorites
Students complete activities using a frequency table and construct a pie graph for the data. In this frequency table lesson, students complete a survey to find data for a frequency table. Students use the given link to make a pie graph...
Curated OER
Who Represents You?
Students investigate Congress and how individuals are represented in this Country. In this government instructional activity, students complete worksheets research government web sites to determine which senators and congressmen...
Curated OER
Lesson 7: Smart Grids
Energy conservation is a hot topic these days; introduce your kids to the Smart Grid solution through a video clip and several interactive online tools. They discuss areas of household energy consumption, examining a pie chart...
Curated OER
Dealing With Data
Young scholars collect, organize, and display data using a bar graph, line graph, pie graph, or picture graph. They write a summary describing the data represented and compare the graph to another graph in the class.
Curated OER
Apple Adjectives
Study different apple varieties and use appropriate adjectives to describe them. Learners alphabetize both the apple names and the adjectives before creating spreadsheet, bar, and pie graphs. A mix of language arts, technology, and math!
Curated OER
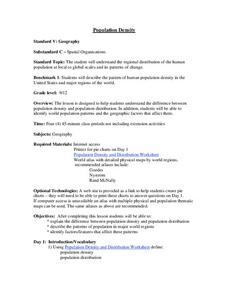
Population Density
Students examine world population density and population distribution. They create pie charts showing population distribution and analyze population patterns in the United States and major regions of the world. They identify...
Curated OER
State Economy Chart
Fifth graders research and record statistics on the economy of an assigned state. They create a spreadsheet in Excel to report the data and a 3D Pie graph using the Chart Wizard in Excel to represent their states' data.
Curated OER
Time Management
Students plot activities for a 24 hour day. They record their information on a spread sheet program. Students list categories they use and write equations for cells that add cells of each category together. Students create a pie chart of...
Curated OER
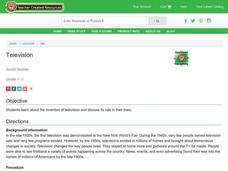
Television
Students investigate the invention of television and examine its role in their lives. They read and discuss an informational handout, list the pros and cons of television on a worksheet, and create a class pie graph illustrating the...
Curated OER
Investigating: Interpreting Graphs and Analyzing Data
Students explore statistics by researching class birthday data. In this data analysis lesson, students investigate the different birthdays among their classmates and create data tables based on the given information. Students view bar...
Curated OER
Tables, Charts and Graphs
Students examine a science journal to develop an understanding of graphs in science. In this data analysis lesson, students read an article from the Natural Inquirer and discuss the meaning of the included graph. Students create a...
CPO Science
Science Worksheets
If you need an array of worksheets to augment your science lessons, peruse a collection of assignments that is sure to fit your needs. With topics such as metric conversion, the scientific method, textbook features, research skills,...
Curated OER
Fairy Tales
Sixth graders explore the elements of fairy tales. In this fairy tales lesson, 6th graders analyze several versions of Cinderella from around the world. Students graph fairy tale elements using Excel and create Venn diagrams comparing...
Curated OER
The Muckrakers Interdisciplinary Unit
Eighth graders complete an Interdisciplinary Unit on the Muckrakers and the Progressive Movement. Students describe life in America and how Progressive Reformers changed it. identify specific problems and propose solutions. Students...
Sharp School
Geography Project
This very simple geography project can lead to a lot of useful referential information that can be displayed in your classroom! Learners construct a poster-size map of a country, identifying major demographic points and including pie/bar...
Curated OER
International Business Travel Project
Young scholars research and develop a plan for an international business trip. They conduct Internet research, prepare a structured itinerary, and develop an oral presentation that includes a pie chart itemizing the trip's expenses.
Curated OER
Betting on China
Middle schoolers study the USA Today articles about the economic rise and dominance of China. In this Chinese economy lesson, students read the article about China as an economic threat to the United States. Middle schoolers study a pie...
Curated OER
Using Spreadsheets and Graphs
Third graders explore mathematics by utilizing computers. In this graphing lesson, 3rd graders gather class data based on a particular topic such as the "favorite candy" of the class. Students utilize this information and computers to...
Curated OER
Sweet Data
Students input data about the colors of their serving of M&M candies onto a spreadsheet. They create charts and graphs based on this information.
Curated OER
Graph Both Crusts
Fourth graders calculate the angles and construct a pie graph of the percentages of the elements in the continental and oceanic crusts. Then they analyze the results. They can be assigned the task of researching the percentages.
Curated OER
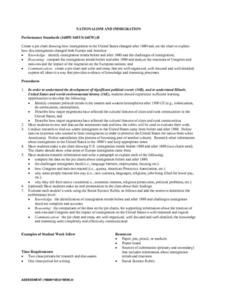
Nationalism and Immigration
Students use the internet to research how immigration patterns changed after 1880. Using this information, they create a pie chart to organize it effectively and discuss how immigration changed Europe and the United States. They also...
Curated OER
Ratios Through Social Studies
Students analyze and integrate mathematical concepts within the context of social studies. They gather, present and analyze information on a bar graph, pie chart, etc. Students compute ratios. They demonstrate that ratios have real-world...
Curated OER
State Economy Chart
Fifth graders create a 3D Pie graph using the Chart Wizard in Excel to represent their assigned states' data. They discuss the similarities and differences between states, and form a hypothesis on the relationship between location and...
Other popular searches
- Pie Charts and Graphs
- Interpreting Pie Charts
- Fraction Circles Pie Chart
- Circle Graphs Pie Charts
- Energy Pie Chart
- Reading a Pie Graph
- Creating a Pie Chart
- Bar Graphs, Pie Charts
- Pizza Pie Graph
- Nutrition Facts Pie Graph
- Pie Chart Activity
- M&m Pie Chart


