Curated OER
Sweet Data
Students input data about the colors of their serving of M&M candies onto a spreadsheet. They create charts and graphs based on this information.
Curated OER
Foliage Tracker
Young scholars discuss the change of leaf colors and the role that climate and elevation play in those changes. They then track leaf changes, input data, and graph foliage changes with a free online tool.
Curated OER
Survey Says...
Young learners create and implement a school-wide survey about student body favorites! Learners record and analyze the data on a bar graph, picture graph, and line graph, and then display the data. Then, wrap it all up with a celebration...
Curated OER
Jellybean Graphs
Second graders predict and graph data based on the color of jelly beans they think are in a handful. In this prediction lesson plan, 2nd graders will predict how many of each color jellybean are in a handful. Then they graph these...
Curated OER
Math: Football Fever Fun
Students compile statistics from high school or other football team and construct a spreadsheet on which to record their findings. Using Chart Wizard to analyze the data, they construct charts and graphs for a visual display of the...
Curated OER
Name Count and Graph
Students find the frequency of a name in selected states by using the Internet. They input data into a spread sheet. They create a graph that illustrates the gathered information.
Curated OER
Time Management
Students plot activities for a 24 hour day. They record their information on a spread sheet program. Students list categories they use and write equations for cells that add cells of each category together. Students create a pie chart of...
Curated OER
How Tolerant Are Kids in Your School?
Students graph results of a survey about attitudes and tolerance in their school. They discuss the social climate of their school. Students complete a questionnaire, and tabulate the raw data from their class. They create a bar graph...
Curated OER
Tracking Data Using Quickoffice on a Palm Handheld
Sixth graders keep track of the amount of garbage they threw away over 3 days time. They graph and analyze data and participate in discussions. They draw conclusions based on their data.
Curated OER
M & M Madness
Second graders graph M & M's by color. In this graphing lesson plan, 2nd graders first predict how many of each color they think are in a handful of M & M's. Then they graph the amounts of each color on a computer program....
Curated OER
Using a Statistical Procedure To Search A Database For Out of the Ordinary Values
Students develop a spreadsheet containing formulas and find summaries for them. In this investigative instructional activity students choose a topic, investigate it and use MS Excel to sort data.
Curated OER
Paying for Crime
Students participate in activties examining ratios and proportions. They use graphs to interpret data showing the government's budget for prisons. They present what they have learned to the class.
Curated OER
The First Nations, Métis, and Inuit Peoples of Canada
Students explore demographic shifts. In this Canadian Census lesson, students interpret data from the 2006 Census to determine the needs of the Aboriginal population in the country.
Curated OER
Alzheimer's Disease
Investigate Alzheimer's disease. Conduct research using a variety of resources, obtain information, and input the data into a Microsoft Excel spreadsheet. Identify trends in the data and categorize them for an audience.
Curated OER
Boats Graph
Students read from the Bible about the travels of Paul, particularly the boat rides. They trace Paul's travels on a map of Asia Minor. Students review a field trip they took and make a graph showing the numbers of each type of boat they...
Curated OER
And the Survey Says...
Students use technology to input, retrieve, organize, manipulate, evaluate, and communicate information; apply appropriate technologies to critical thinking, creative expression, and decision-making skills. They collect and explore data...
Curated OER
Hermit Crab Races
Students predict the speeds of humans and hermit crabs and investigate their predictions using ratios and formulas. AppleWorks is used for this lesson, which includes a data worksheet.
Curated OER
Are We Alone
Seventh graders collect/analyze data and draw conclusions; support reasoning by using a variety of evidence; construct logical arguments; access information at remote sites using telecommunications; apply the concept of percent;...
Curated OER
Analysing 2001 Census Microdata
Eighth graders examine the census data of 2001. In this American History lesson, 8th graders analyze data using one- and two-variable statistical analysis. Students develop a research question that makes use of the...
Curated OER
Pulse Rates
Students answer the question, "How will the intensity of exercise effect your heart rate?", using physical workouts and AppleWorks, or similar spreadsheet program. This lesson can conclude with the creation of a graph of data collected.
Curated OER
Ecosystems
Students create plots of land in three different ecosystems and use AppleWorks to collect data for research. This lesson includes a downloadable worksheet and can be accomplished in four days.
Curated OER
And the Winner Is...
Third graders participate in an election project. They collect data to create a spreadsheet from which a graph is generated.
Curated OER
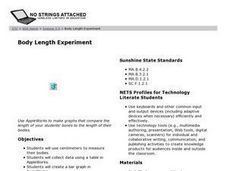
Body Length Experiment
Students measure the lengths of their bodies and various body parts to determine the relationship (or lack of one) between body part length and the length of the entire body. A spreadsheet program is suggested for data collection.
Alabama Learning Exchange
Light, Dry and Nutritious - A Look at Dehydrated Food
Fifth graders study dehydration and dehydration of foods. They measure the amount of water lost from fruits as they are dehydrated. They use desktop publishing software to design an advertisement for dehydrated fruit after researching...


