Curated OER
A world of oil
Students practice in analyzing spatial data in maps and graphic presentations while studying the distribution of fossil fuel resources. They study, analyze, and map the distribution of fossil fuels on blank maps. Students discuss gas...
Illustrative Mathematics
Rainfall
Ideal for use as an introduction to the idea of inverse functions, this activity investigates rainfall as a function of time. Learners use the data displayed in a table of values to analyze the function and its inverse, including why the...
Agile Mind
Isabella’s Credit Card
An in-depth activity that involves a real-world problem about credit card debt. Learners are given a scenario in which Isabella plans to stop using her credit card and pay off the balance by paying a fixed amount each month. The first...
National Security Agency
Starting a Restaurant
Through an engaging unit, chefs-in-training will sort and classify data using tally charts. Learners will also create bar graphs to display restaurant data and interpret data from bar graphs using a variety of categories. This is a fun...
Curated OER
Using GLOBE Data to Study the Earth System (College Level)
Students use the GLOBE Website to locate and study environmental data. They use the GLOBE Graphing Tool to display data. Students describe the role of solar energy in the annual fluctuations of soil moisture. They describe reservoirs and...
EngageNY
Connecting Graphical Representations and Numerical Summaries
Which graph belongs to which summary statistics? Class members build upon their knowledge of data displays and numerical summaries to connect the two. Pupils make connections between different graphical displays of the same data in the...
US Department of Commerce
Looking at Numbers of Births Using a Line Graph
Was there a baby boom? Using census data, class members take a look at the number of 8-11 year olds and determine their birth years. Scholars create a double line graph to compare the number of births for two states for several years....
Workforce Solutions
30 Seconds
Thirty seconds are all scholars have to develop an engaging commercial to showcase their talents and experience within a specific occupation. Pairs work collaboratively to keep each other on time to deliver information speedily and ask...
Teach Engineering
The Challenge Question
A research position becomes a modeling job. The introductory lesson in a series of nine presents the challenge of analyzing a set of bivariate data. The class brainstorms what the data may represent. Pupils must decide what is needed to...
EngageNY
Describing Distributions Using the Mean and MAD II
The 11th instructional activity in the series of 22 is similar to the preceding instructional activity, but requires scholars to compare distributions using the mean and mean absolute deviation. Pupils use the information to make a...
American Statistical Association
How Long is 30 Seconds?
Is time on your side? Pupils come up with an experiment to test whether their classmates can guess how long it takes for 30 seconds to elapse. They divide the class data into two groups, create box-and-whisker plots, and analyze the...
Carolina K-12
The Results are In! Examining Our First Vote Election
The 2016 election is over, and now it's time to dig in to some data! An activity revolves around data gathered from the First Vote Project in North Carolina wherein thousands of learners voted. After diving in to the data using provided...
EngageNY
The Mean Absolute Deviation (MAD)
Is there a way to measure variability? The ninth resource in a series of 22 introduces mean absolute deviation, a measure of variability. Pupils learn how to determine the measure based upon its name, then they use the mean absolute...
Museum of Tolerance
Why is This True?
Are wages based on race? On gender? Class members research wages for workers according to race and gender, create graphs and charts of their data, and compute differences by percentages. They then share their findings with adults and...
Howard Hughes Medical Institute
Niche Partitioning Activity
Dinnertime on the African savanna is a highly choreographed event! Introduce young ecologists to the concept of niche partitioning through a hands-on activity. Pupils research animal behaviors and use data to develop an understanding of...
Radford University
Super Survey!
Here's a super survey on supermarket products. An interactive lesson has classmates design and conduct surveys on a product of interest. They analyze the data, choose a data display method, and present their findings to the class.
PBS
The Lowdown — Exploring Changing Obesity Rates through Ratios and Graphs
Math and medicine go hand-in-hand. After viewing several infographics on historical adult obesity rates, pupils consider how they have changed over time. They then use percentages to create a new graph and write a list of questions the...
US Department of Commerce
Immigration Nation
People come and people go. Given tabular census data on the annual number of immigrants from four different regions of the world between 2000 and 2010, pupils create double bar graphs and line graphs from the data. They analyze their...
Virginia Department of Education
Growing Patterns and Sequences
Learners explore, discover, compare, and contrast arithmetic and geometric sequences in this collaborative, hands-on activity. They build and analyze growing patterns to distinguish which kind of sequence is represented by a set of data...
Bonneville
Solar Powered Water Pumping
Here's the perfect lesson for those who think the world needs faster pumps. Building on the previous activity, scholars work to make the pumps function faster in transferring water between containers. They try adding an additional solar...
American Statistical Association
The Gumball Machine
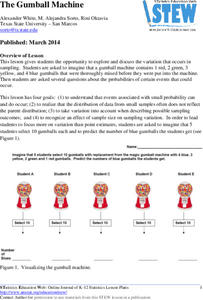
Chew on an activity for probability. Given information on the number of gumballs in a gumball machine, scholars consider how likely it is to randomly draw a blue gumball and how many of each color they would draw in 10 trials if the...
Curated OER
Spaghetti Graphs
Students work in pairs to test the strength of spaghetti strands. They collect and graph data to determine a line of best fit. Students create a linear equation to interpret their data. Based on the data collected, students predict...
EngageNY
Random Sampling
Sample pennies to gain an understanding of their ages. The 16th installment of a 25-part series requires groups to collect samples from a jar of pennies. Pupils compare the distribution of their samples with the distribution of the...
NASA
Cloudy vs. Clear - Graphs
Explore the link between solar energy and cloud cover using real data from NASA from China! Future climatologists analyze and interpret graphs of solar energy on clear and cloudy days using a literacy cube. Investigators draw conclusions...
Other popular searches
- Data Display
- Misleading Data Display
- Appropriate Data Display
- Graphs and Data Display
- Display Simple Data
- Analyze Data Displays
- Data Display Center
- Voluntary Data Display
- Best Data Display
- Rates and Data Display
- Simulation Data Display
- Ways to Display Data


