EngageNY
The Mean Absolute Deviation (MAD)
Is there a way to measure variability? The ninth resource in a series of 22 introduces mean absolute deviation, a measure of variability. Pupils learn how to determine the measure based upon its name, then they use the mean absolute...
Museum of Tolerance
Why is This True?
Are wages based on race? On gender? Class members research wages for workers according to race and gender, create graphs and charts of their data, and compute differences by percentages. They then share their findings with adults and...
Virginia Department of Education
Growing Patterns and Sequences
Learners explore, discover, compare, and contrast arithmetic and geometric sequences in this collaborative, hands-on activity. They build and analyze growing patterns to distinguish which kind of sequence is represented by a set of data...
Bonneville
Solar Powered Water Pumping
Here's the perfect lesson for those who think the world needs faster pumps. Building on the previous activity, scholars work to make the pumps function faster in transferring water between containers. They try adding an additional solar...
American Statistical Association
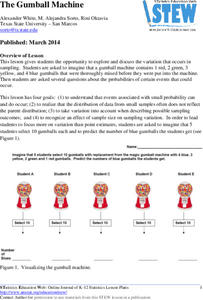
The Gumball Machine
Chew on an activity for probability. Given information on the number of gumballs in a gumball machine, scholars consider how likely it is to randomly draw a blue gumball and how many of each color they would draw in 10 trials if the...
Curated OER
Spaghetti Graphs
Students work in pairs to test the strength of spaghetti strands. They collect and graph data to determine a line of best fit. Students create a linear equation to interpret their data. Based on the data collected, students predict...
EngageNY
Random Sampling
Sample pennies to gain an understanding of their ages. The 16th installment of a 25-part series requires groups to collect samples from a jar of pennies. Pupils compare the distribution of their samples with the distribution of the...
NASA
Cloudy vs. Clear - Graphs
Explore the link between solar energy and cloud cover using real data from NASA from China! Future climatologists analyze and interpret graphs of solar energy on clear and cloudy days using a literacy cube. Investigators draw conclusions...
K20 LEARN
Ecosystems, Human Activity, And Interactions, Oh My!: Human/Environment Interaction
Word clouds about ecosystems hook learners into a lesson that explores Yellowstone wildlife. Young scientists create cause-and-effect relationships after examining data and recommend solutions to their observed problems. More data...
Anti-Defamation League
Pink Collar Jobs: Gender Segregation and Pay Inequality in the Workplace
Cartoons showing women in the workplace spark a discussion about being a business executive and claiming the corporate ladder. Small groups analyze data and create graphs that display essential information from the handouts. The class...
NASA
Two Versions of Gravity: Newton and Einstein
We have all heard the debate about teaching both theories, but an innovative lesson takes the discussion to a new level. Scholars research and debate Newton's Law of Gravitation versus Einstein's General Theory of Relativity with...
National Wildlife Federation
Climate Solutions – A Call to Action!
The final lesson in the 21-part series on climate change focuses on energy solutions to the consumption problem. Using data specific to their school, pupils make recommendations, follow up on actions, and carefully track progress....
EngageNY
Describing a Distribution Displayed in a Histogram
The shape of the histogram is also relative. Learners calculate relative frequencies from frequency tables and create relative frequency histograms. The scholars compare the histograms made from frequencies to those made from relative...
Missouri Department of Elementary
Fly Your Kite
Encourage scholars to become a productive community member with a kite-themed lesson. Following a review and discussion, learners complete a Venn diagram that displays the connection between character traits needed to make a home and...
EngageNY
Relationships Between Two Numerical Variables
Is there another way to view whether the data is linear or not? Class members work alone and in pairs to create scatter plots in order to determine whether there is a linear pattern or not. The exit ticket provides a quick way to...
Curated OER
Level III: Technology Integration
Fourth graders prepare two spreadsheets each with an embedded line graph that displays data about the growth of the bitter rot fungus on apples and on petri dishes that were stored in the refrigerator and the classroom. They prepare a...
Virginia Department of Education
Quadratic Curve of Best Fit
Class members create a table of the number of chords that can be drawn given the number of points on a circle. Pupils analyze the data created, find a function to fit to it, and use the function to make further predictions.
Curated OER
Understanding Weather and Climate Patterns
Students research the climate patterns of various locations and make predictions based on their findings. They determine the importance of latitude and longitude in weather and climate. Students create graphs displaying their collected...
Museum of Tolerance
Where Do Our Families Come From?
After a grand conversation about immigration to the United States, scholars interview a family member to learn about their journey to America. They then take their new-found knowledge and apply their findings to tracking their family...
Curated OER
Information at a Glance - Using Tables in Mathematics
Young scholars create table to display GED Testing data located in paragraph provided by teacher, use information in table to create appropriate graph, and determine percentage difference between passing scores and failing scores.
Curated OER
Learn How to Graph
Young scholars examine various types of charts and discover how to construct a line graph. Using graph paper, they construct a graph displaying weight loss over a five-year period. They draw copnclusions from the completed graphs.
Institute for Humane Education
I've Been Branded!
How many pairs of Nikes® or Apple® products are in the average American home? What makes someone buy one particular type of laundry detergent over another? Scholars grapple with these questions as they develop a list of brands they use...
Texas Education Agency (TEA)
Developing Speed (Alpha, Numeric, and Keypad)
Hurry up! Pupils practice developing speed on a keyboard, participating in a series of drills to improve efficiency. After tracking their progress, they create an electronic guide about proper keyboarding techniques.
George Washington's Mount Vernon Estate & Gardens
George Washington: Centerpiece of a Nation
A neat Presidents Day activity, this lesson plan provides a culminating learning experience for upper elementary aged learners. After analyzing George Washington's, "A Display of the United States of America," your learners will conduct...
Other popular searches
- Data Display
- Misleading Data Display
- Appropriate Data Display
- Graphs and Data Display
- Display Simple Data
- Analyze Data Displays
- Data Display Center
- Voluntary Data Display
- Best Data Display
- Rates and Data Display
- Simulation Data Display
- Ways to Display Data


