Curated OER
Escape Velocity
Sixth graders create/use spreadsheets to solve real-world problems, explore patterns, make predictions, select/explain most appropriate types of graph to display data, use information to create product, and have basic understanding of...
ESL Kid Stuff
Daily Routines & Times of the Day
What time do you eat breakfast? Or go to school? Language learners practice crafting and answering questions about their daily routines.
Curated OER
There's No Accounting for Good Journals
Tenth graders create journals on their spending habits. In this money-management lesson plan, 10th graders create and keep journals of their personal income and expenditures. Students learn to use Excel to create a spreadsheet for their...
Curated OER
Putting Your Money to Work
Students create a collect data on expenses. In this algebra lesson, students create a spreadsheet to solve scientific equations. They incorporate math, science and technology in this lesson.
Curated OER
Thinking Outside the Box
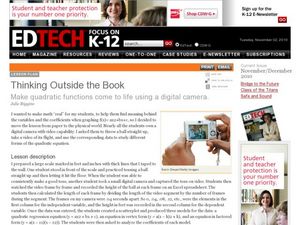
Now this lesson sounds fun! Students throw a ball, film it as it soars through the air, and use a spreadsheet to collect data. A scatterplot is created to produce a quadratic regression equation, an equation in vertex form, and an...
Curated OER
Budget Making
Students develop a budget for spending and saving. For this economics lesson, students create a budget based on personal, family and government income. They discuss jobs at home and allowances. They discuss how they manage their money...
Curated OER
Introduction to the National Debt
Students relate the national debt to the economy. In this algebra instructional activity, students discuss what the national debt is, create a national budget based on priority and what the government should spend money on. They analyze...
Polar Trec
Temperature Profile above the South Pole
Collecting and understanding data is a big part of understanding the world and how it changes. To better grasp what temperatures are changing and how they affect global populations, learners create a graph based on the date provided....
Yummy Math
Parametric Equations and a Heart
Trigonometry, art, and Valentine's Day come together in a creative activity about parametric equations. Learners calculate several equations before graphing them either by hand, on a graphic calculator, or Excel spreadsheet to curve...
Curated OER
Using Excel to Draw a Best Fit Line
Middle schoolers create line graphs for given data in Microsoft Excel. Students follow step by step instructions on how to create their graph, including how to create a trend line. Middle schoolers print graphs without trend lines and...
Curated OER
Graphing
Learners gather statistical information on a chosen topic and place it into a spreadsheet. Using th Excel chart wizard, students create tables, graphs and charts of their information. They interpret the data and share it with the class.
Curated OER
Math: Football Fever Fun
Learners compile statistics from high school or other football team and construct a spreadsheet on which to record their findings. Using Chart Wizard to analyze the data, they construct charts and graphs for a visual display of the...
Curated OER
Made Round To Go Round
In this lesson plan students investigate what it would cost to furnish one room of their choice by shopping on the Internet. Both Australian and American dollars are to be given for each item to demonstrate the difference between two...
Curated OER
Don't Lose Your Load!
Students create graphs using collected data. In this algebra instructional activity, students use spreadsheet in Excel to create graphs to interpret their data and make predictions. They rewrite word problems using algebraic expressions.
Curated OER
Finding Mean, Mode and Median in the Computer Lab
Young scholars create spreadsheets which will display and figure mean, median, and mode of a set of numbers.
Curated OER
What's Your Shoe Size? Linear Regression with MS Excel
Learners collect and analyze data. In this statistics lesson, pupils create a liner model of their data and analyze it using central tendencies. They find the linear regression using a spreadsheet.
Curated OER
What's Up With My Class
Students collect data about their class and they use Excel spreadsheet to display their tables and graphs about the class. They answer survey questions and collect their data. Students create a graph of their choice to display the...
Curated OER
The Hot Dog Stand
Students run a computer simulation. They collect data as they work and use the data to create an annual report for their business. Several different simulations could be used for this project. It is desirable for students to do this...
Curated OER
Graphing
Fifth graders create graphs based on climate in South Carolina. They read and interpret information in a chart and construct a graphy from the information in the chart. They create a spreadsheet using Excel and publish 2 graphs.
Curated OER
Which Color Will You Pick?
Students create a spreadsheet to chart the different colors found in a package of M&M's or Skittles. They collect data, create appropriate charts, and use percentages to describe quantities.
Curated OER
Why Would I Owe My Soul to the Company Store?
Sixth graders listen to "Sixteen Tons" by Tennessee Ernie Ford and discuss what it means to owe one's soul to a store. In this mathematics lesson, 6th graders determine what a miner's income was minus his expenses graphing findings in a...
Curated OER
Running a Business
Students discuss spreadsheets and how they work. They then imagine they are owners of a store, determine twenty items that they would sell, and create spreadsheets to record amounts of each item sold in a two-week period. After entering...
Curated OER
Ladybugs in the Garden
Fifth graders estimate the size a population (ecosystems) Students make a chart from information collected then create a graph (line or bar) from this information. Students do a lesson where they observed, examine, and record data...
Chicago Botanic Garden
Micro-GEEBITT Climate Activity
A truly hands-on and inquiry based learning activity bridges all the lessons in the series together. Beginning with a discussion on average global temperatures, young meteorologists use real-world data to analyze climate trends in order...


