Math Mammoth
Stem-and-Leaf Plots 3
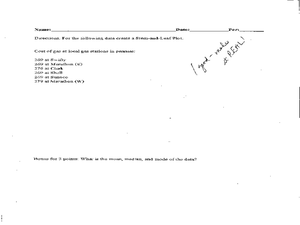
In this stem-and-leaf instructional activity, students place statistical data in a stem-and-leaf plot. They identify the median, and range in a given set of data. There are four multi-step problems on this one-page instructional activity.
Curated OER
Frequency Tables and Stem-and-Leaf Plots
Students are introduced to the function of frequency tables and stem and leaf plots. In groups, they determine the frequency of their teacher coughing, ringing a bell or raising their hand. To end the lesson, they determine frequency...
Curated OER
Stem-and-Leaf Plots
Seventh graders study steam-and-leaf plots. Given specific data, they create a stem-and-leaf plot . Students identify the mean, mode, range and median. Afterward, they review vocabulary words.
Curated OER
Button Bonanza
Collections of data represented in stem and leaf plots are organized by young statisticians as they embark some math engaging activities.
Curated OER
Stem and Leaf Plots and Circle Graphs
Students graph and plot numbers and analyze their data. In this algebra lesson, students identify the different properties of a stem and leaf plot. They decide which type of graph to use when it comes time to analyze their data.
Curated OER
Stem-and- Leaf Plots
Learners are introduce to the notion of stem-and-leaf plots. They use stem-and-leaf plots to calculate the mean, median, and mode of a set of data. Students use computers to learn about stem-and-leaf plots.
Curated OER
How Tall is the Average 6th Grader?
Upper grade and middle schoolers explore mathematics by participating in a measuring activity. They hypothesize on what the average height of a male or female 6th grader is and identify ways to find the average mathematically. Learners...
Curated OER
Breakfast Cereal - How Nutritious Is Yours?
Middle schoolers analyze the nutritional value of breakfast cereal in order to make an informed choice. They create a stem and leaf plot which analyzes the nutritional value of the cereal they eat on a regular basis. Students write a...
Curated OER
Flicking Football Fun
Young mathematicians fold and flick their way to a deeper understanding of statistics with a fun, hands-on math unit. Over the course of four lessons, students use paper footballs to generate data as they learn how to create line...
Shmoop
Box, Stem-Leaf, and Histogram
A helpful and versatile instructional activity requires young mathematicians to analyze data in order to create graphs and answer questions. Additionally, it prompts learners to find the mean, median, mode, and range of some of the data...
Curated OER
Box Plots
Young statisticians are introduced to box plots and quartiles. They use an activity and discussion with supplemental exercises to help them explore how data can be graphically represented.
Curated OER
Plot It
Students use a stem-and-leaf plot from a set of data to identify the range, median, and mode of their own math grades.
Houghton Mifflin Harcourt
Unit 3 Math Vocabulary Cards (Grade 5)
Fifty-four flashcards make up a set to help reinforce math vocabulary. The set offers two types of cards; a word card printed in bold font, and a definition card equipped with an example and labels. Terms include capacity, histogram,...
Curated OER
Statistics with State Names
Students analyze the number of times each letter in the alphabet is used in the names of the states. For this statistics lesson, students create a stem and leaf plot, box and whisker plot and a histogram to analyze their data.
Curated OER
Who's got the fastest legs?
Students use a stopwatch to collect information for a scatterplot. In this fastest legs lessons, students collect data through the taking of measurements, create and find a median number. Students develop an equation and answer...
Curated OER
Box-and-Whisker Plots
Eighth graders measure in feet and inches and convert to explore the relationship between the converted measurements. In this measurement lesson plan, 8th graders use the whisker and box plot to represent the measurement of a cat. ...
Curated OER
The Dog Days of Data
Students practice an alternative form of data presentation. They practice sequencing data, identifying the stem-and-leaf, creating stem-and-leaf plots, and drawing inferences from the data by viewing the plots.
Curated OER
Types of Graphs
Fifth graders construct graphs. In this graphing lesson, 5th graders learn about various types of graphs such as bar, line, circle, picture and stem and leaf plot. Students work in groups to create examples of each graph.
Curated OER
Weather Watchers
Students collect and analyze data about the weather. For this algebra lesson, students organize and graph their data using graphs, line plots and stem and leaf plots. They make observation and draw conclusion using their data.
Curated OER
comparison of Two Gender Sports Teams
Students gather data on sports team and create a box and whisper plot. In this data collection lesson, students find the median, the quartile range, and relationships between variables.
Curated OER
Box and Whiskers
Middle schoolers discover how to relate collected data with a box and whiskers graph in a number of formats. They collect, organize, create, and interpret a box and whiskers graph. Pupils interpret the difference between sets of data,...
Curated OER
Hurricane Tracking
Students access the Internet to find information on current hurricanes. They get locations, speeds, and air pressures and then plot the location of the hurricane on a hurricane-tracking map. They also access the FEMA website to solve...
Virginia Department of Education
Middle School Mathematics Vocabulary Word Wall Cards
Having a good working knowledge of math vocabulary is so important for learners as they progress through different levels of mathematical learning. Here is 125 pages worth of wonderfully constructed vocabulary and concept review cards....
Curated OER
Raisin the Statistical Roof
Use a box of raisins to help introduce the concept of data analysis. Learners collect, analyze and display their data using a variety of methods. The included worksheet takes them through a step-by-step analysis process and graphing.


