West Contra Costa Unified School District
Introduction to Conditional Probability
Here is a turnkey instructional activity that walks young statisticians through the development and uses of conditional probability. From dice games to surveys, Venn diagrams to frequency tables, the class learns how a given can...
Lincoln Public Schools
Cereal Box Project
Challenge your class with this fun and engaging engineering design project. The goal, to create a brand new cereal complete with a list of ingredients, a name and logo, and a box to hold it in. Starting with a survey to determine the...
Math Moves U
Collecting and Working with Data
Add to your collection of math resources with this extensive series of data analysis worksheets. Whether your teaching how to use frequency tables and tally charts to collect and organize data, or introducing young...
K-5 Math Teaching Resources
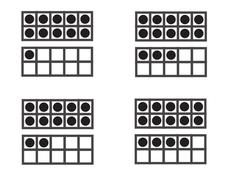
Small Ten Frame Cards with Dots
Solidify your mathematicians' addition and subtraction skills using this ten frame printable. Here, you'll find small, ten frame cards with dots representing numbers 11 to 22, equipped to enhance math strategies and boost proficiency.
Los Angeles County Office of Education
Assessment For The California Mathematics Standards Grade 6
Test your scholars' knowledge of a multitude of concepts with an assessment aligned to the California math standards. Using the exam, class members show what they know about the four operations, positive and negative numbers, statistics...
Curated OER
Survey and Tally
Second graders view a model of a survey and tally. In this survey and tally lesson, 2nd graders decide on questions for a survey. Students conduct the survey and tally their results. Students create a tally chart....
Curated OER
Button Bonanza
Collections of data represented in stem and leaf plots are organized by young statisticians as they embark some math engaging activities.
Curated OER
Drive the Data Derby
Three days of race car design and driving through the classroom while guessing probability could be a third graders dream. Learn to record car speed, distances traveled, and statistics by using calculation ranges using the mean, median,...
PwC Financial Literacy
Saving and Investing: Investing for the Future
A fine lesson on saving and investing is here for you and your middle schoolers. In it, learners explore the values of time and money, and discover how small amounts of money invested over time can grow into a large "pot of gold." They...
Curated OER
And the Survey Says...
Create a survey and graph! In this graphing lesson, students listen to a story about pets, create a survey for family and friends about what pets they own, and use the information to create a bar and line graph.
Curated OER
Using Algebra to Explore Problem Space
Students apply their knowledge of math by rewriting word problems using equations. In this word problem lesson, students build upon previous knowledge as they set up the correct steps to solve word problems. This lesson is full of hints...
Curated OER
Surveying: 19 Chains and 50 Links
Through an interdisciplinary lesson, emerging engineers explore the history of surveying systems. After discussing various systems, they perform surveys on printable pages. Using their geometric skills, they physically stake out plots...
Curated OER
Math of the Path: Students Calculate Data from the Lewis and Clark Journey
Students use calculations to complete the same journey of Lewis and Clark. They answer questions along their way and share information they gather with the class. They compare their calculations with those made by Lewis and Clark.
Curated OER
Plotting Data on a Graph
Students investigate graphing. In this graphing lesson, students survey the class and create graphs to reflect the data collected.
Curated OER
Graphing Surveys
Learners collect data and graph it. In this algebra lesson, students create a survey for their classmates and teachers. They analyze the results from the survey and graph it. They draw conclusion from their data based on the graph.
Curated OER
Build Your Dream Science Lab
Would your ideal science lab be filled with bubbling beakers and zapping Tesla coils? Or would it contain state-of-the-art computer technology and data analysis? Dream big with an innovative lesson that connects math and language...
Curated OER
Practice: Word Problems
Congratulations, you've just hit the word problem jackpot! Covering an incredible range of topics from integers and fractions, to percents, geometry, and much more, this collection of worksheets will keep young mathematicians...
Curated OER
All About Graphs
Students practice organizing data by creating graphs. In this statistics lesson, students survey the class about favorite colors and create a bar graph using the data. Students complete a test based on pet and animal statistics.
National Security Agency
Are You Ready to Call the Guinness Book of Records?
Learners design questions that can be answered by collecting data. In this line-plot activity, pupils collect data and graph on a line plot on world records. An abundant supply of teacher support is provided in this resource.
Curated OER
Give Me A Break!
Students create and conduct a survey. In this broken bones lesson, students discuss if they've ever broken a bone and how a broken bone heals. Students generate questions for a survey on broken bones and healing time, conduct the survey...
Curated OER
Pets Galore!
Fourth graders conduct a class survey on the number of pets that the 4th grade owns and they record that data in their math notebooks. They make a bar graph displaying the results using a spreadsheet through Microsoft Excel.
Curated OER
Survey and Share
Students practice collecting data by surveying other students. In this data collection lesson plan, students decide on a question and collects data from 15 other students. Eventually the students will end up graphing their results.
Curated OER
Ice Cream
Learners explore the concepts of mean, median, mode, and range as they elicit data about people's favorite flavor of ice cream. A practical application of the data obtained offers an extension to the lesson plan.
National Security Agency
Going Green with Graphs
In this unit designed for second graders, youngsters are introduced to conducting surveys and creating tally charts based on the data they gather. Students then construct bar graphs, and observe the relationships between the two...


