Curated OER
Introduction to Representing and Analyzing Data
Represent data graphically. Allow your class to explore different methods of representing data. They create foldables, sing songs, and play a dice game to reinforce the measures of central tendency.
Curated OER
Graph It with Coffee!
Students interview employers and employees at local coffee shops about sales and profits and create graphs comparing and contrasting information obtained about the businesses.
Beyond Benign
The Big Melt: Arctic Ice Caps
Are the Arctic ice caps really melting out of existence? Junior climatologists examine the statistics of ice decline through four math-based lessons. Each activity incorporates data, climate information, and environmental impact into an...
EngageNY
Estimating Probability Distributions Empirically 2
Develop probability distributions from simulations. Young mathematicians use simulations to collect data. They use the data to draw graphs of probability distributions for the random variable in question.
Biology in Motion
Evolution Lab
Evolution occurs though change over time, but can it go any faster? Scholars speed up the process of evolution and observe a simulation of 20 blue organisms fighting for survival. A graph displays the changes in phenotype over time. By...
Curated OER
Voter Turnout
Explore politics by analyzing the voting process. Pupils discuss the purpose of casting votes in an election, then examine graphs based on the data from a previously held election's turnout. The lesson concludes as they answer study...
Curated OER
Weather "Whys"
Students complete activities to explore fall weather. In this weather lesson, students use the given links to examine weather forecasts. Students complete a weather graph activity and watch Internet field trips. Students complete fall...
NASA
Development of a Model: Analyzing Elemental Abundance
How do scientists identify which elements originate from meteorites? Scholars learn about a sample of material found in a remote location, analyzing the sample to determine if it might be from Earth or not. They study elements, isotopes,...
PBS
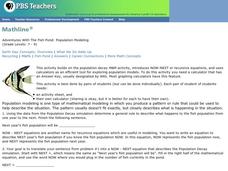
Adventures With The Fish Pond: Population Modeling
Build up from the previous activity where your learners charted the population growth and decay of a fish pond with M&Ms®. Have them look at the data from that activity and create a Now-Next, or recursive equations, to predict the...
Curated OER
WebQuest: Thrills and Spills- Pick Your Park!
Students participate in a WebQuest in which they must determine which amusement park is the "median priced" park. Students visit park websites to accumulate prices for parking, activities, restaurants, and gift shops.
Curated OER
The Lake Effect
Fourth graders conduct an experiment demonstrating the effects of water and air temperature on precipitation. They create graphs demonstrating their findings using Claris Works for Kids.
Curated OER
Under the Sea - Ocean Mammals/Fish
Learners explore the similarities and differences between ocean mammals and fish. The characteristics of the life forms observed are placed onto a graph. The classroom becomes the botom of the sea and is explored to gain the required data.
Curated OER
The Election Connection
Learners participate in a mock election. In this election activity, students vote online in a mock election, graph the results, and compare their results to the nationwide results.
Curated OER
"Real Life" Budgeting Project
Students experience what it is like to be a responsible citizen through a monthly budget through using a variety of research skills.
They apply collected data in a decision making exercise and
present the final product in a clear and...
Curated OER
Probability: The Study of Chance
Students practice the basic principles of probability by conducting an experiment, determining if a game is fair, collecting data, interpreting data, displaying data, conducting analysis, and stating and applying the rule for probability.
Curated OER
Finding Caterpillars
Young scholars examine how animals protect themselves from predators and camouflage themselves. They participate in a simulation in which they locate red and green yarn "caterpillars," organize their data, and generate a bar graph using...
Curated OER
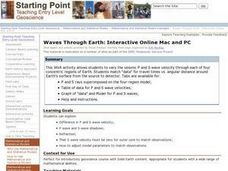
Waves Through Earth: Interactive Online Mac and PC
Students participate in a JAVA activity to vary the seismic P and S wave velocity through each of four concentric regions of Earth. They match "data" for travel times vs. angular distance around Earth's surface from the source to detector.
Space Awareness
Star in a Box
What happens to stars as they get older? A simulation takes pupils through the life cycle of stars based on their masses. The resource introduces the Hertzsprung-Russell diagram and the common relationships and life cycle patterns observed.
Curated OER
Keep Finding the Positive
Fifth graders discuss how a positive self-image can improve their school community. In groups, they are given a set of card in which they examine the role of each. After being given the presenter card, they create a collage about their...
Curated OER
Enough to Make Your Head Spin
Young scholars investigate the world of nonverbal communication by analyzing body language around the world. In this cultural communication instructional activity, students research the Bulgarian language and how we could easily...
Curated OER
Lucky Number
Students use data from simulations to make theoretical generalizations. They discuss possible relationships between several given events and gain understanding about their own mathematical intuition about likelihood.
Curated OER
The Great Pollinators
Students discover the reproductive parts of a plant. In this biology lesson, students identify and categorize several different plants they dissect in class. Students record their information using a data chart.
Curated OER
Science: Trouble in the Troposphere
Students research a NASA Website and record information about an assigned city's tropospheric ozone residual monthly climate. In groups, they graph the information for the past year. They form new groups and compare their city's...
Curated OER
Every Tree For Itself
Fourth graders play a game where they are trees gathering sun, water, and nutrients and CO2 represented by pieces of paper or poker chips. They record their collected requirements and graph how they grew as a forest.


