Google
Write a Linear Equation Foldable
Simplicity and organization accompany the learning of linear equations in this handy foldable. Step by step, learners write a linear equation given two points, and then write a linear equation when given a graph. The point-slope...
Sinclair Community College
Solving Linear Inequalities
Your learners will appreciate the complete picture of linear inequalities presented in this lesson plan. Starting simply with definitions and moving all the way to solving linear inequality word problems this activity is simple to follow...
Laura Candler
Fishbowl Multiplication
Transition young mathematicians from using repeated addition to multiplication with this fun, hands-on activity. Using manipulatives and the included game board, students work in pairs modeling repeated addition problems before...
Math Solutions
Shape Sorting: Looking for Green!
Young mathematicians rotate, flip, and sort their way to an understanding of the different attributes of geometric figures. Using transparent yellow and blue shapes, children try to match congruent figures together to create...
National Research Center for Career and Technical Education
Back to Basics
Your class will enjoy this Health Science lesson created by CTE and math teachers from Missouri. Learners make conversions between the apothecary system and metric and US standard measurements used in the healthcare field. The CTE...
Baylor College
Needs of Plants
What better way to learn about plant life than by creating a class garden? Young botanists start with a brief discussion about radishes before planting seeds and watching them grow. To determine the importance of water, sunlight, and...
Google
Solving Systems of Equations Foldable
Two of the strategies for solving systems of linear equations are represented in this foldable: substitution and elimination. Learners solve three examples of each.
Google
Quadratic Formula Foldable
Learners use the determinant of the quadratic formula to find the number of real number solutions that exist in each given quadratic function.
Google
Foldable Inequalities
Your learners will enjoy this simple summary of finding and graphing the solutions to variable inequalities.
EngageNY
Tables of Equivalent Ratios
Don't table the discussion on equivalent ratios — do it now! Scholars create tables of equivalent ratios to represent contextual problems. Pupils go on to use the tables to answer questions within the context. The instructional activity...
EngageNY
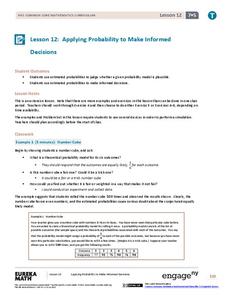
Applying Probability to Make Informed Decisions
Use simulations to determine the probabilities of events to make decisions. Class members are presented with several scenarios, some with known probabilities and others without. Groups run simulations to gather data that they then use to...
EngageNY
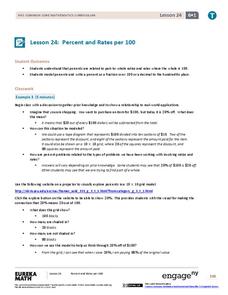
Percent and Rates per 100
What percentage of your class understands percents? Pupils learn the meaning of percents based upon rates per 100 in the 24th instructional activity in a series of 29. They represent percents as fractions, decimals, ratios, and models....
EngageNY
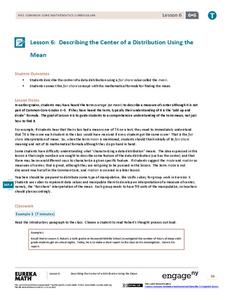
Describing the Center of a Distribution Using the Mean
Everyone does their fair share. The sixth segment in a 22-part unit presents the mean as a fair share. Groups build a conceptual understanding of the mean of a data set, rather than simply learn an algorithm. Learners use the...
Chapman University
Graphs of the Sine and Cosine Function in Degrees
This bright, clear, graphic, display of the sin(x) and cos(x) functions spans the domain between -360 degrees and 360 degree. Use it as a poster, handout, presentation slide, or project it onto a whiteboard.
Chapman University
Graphs of the Sine and Cosine Function in Radians
This bright, clear, graphical display of the sin(x) and cos(x) functions spans the domain between -2 pi radians and 2 pi radians. Use it as a poster, handout, presentation slide, or project it onto a whiteboard.
Chapman University
Derivative of sin x
Direct and to the point (the slope at a point that is) describes this one-page proof of the derivative of the sin(x). The definition of a derivative using a limit is the first step in this sequential, algebraic, explanation of how the...
Henrico County Public Schools
Solving Systems of Equations by Substitution
There is no substitute for checking the solution. A short introduction to the substitution method of solving systems of equations is an ideal resource for algebra classes. The slides present steps for the substitution method and apply...
Henrico County Public Schools
Solving Systems of Equations by Elimination
Eliminate the obvious. A series of slides presents algebra classes with step-by-step procedures for solving systems of equations using the elimination method. It provides an introduction to the elimination method for solving linear...
Virginia Department of Education
Box-and-Whisker Plots
The teacher demonstrates how to use a graphing calculator to create box-and-whisker plots and identify critical points. Small groups then create their own plots and analyze them and finish by comparing different sets of data using box...
Virginia Department of Education
Line of Best Fit
Pupils work through a guided activity on fitting a linear equation to a set of data by entering the data into a calculator and trying to envision a line of best fit. They then have the calculator determine the least-squares line and...
Virginia Department of Education
Scientific Notation
Writing a number is all in the notation. The resource introduces the class to scientific notation. Pupils learn the process of taking a very large or small number in standard form and write it in scientific notation. To practice,...
EngageNY
Estimating Centers and Interpreting the Mean as a Balance Point
How do you balance a set of data? Using a ruler and some coins, learners determine whether the balance point is always in the middle. Through class and small group discussions, they find that the mean is the the best estimate of the...
EngageNY
The Volume of Prisms and Cylinders and Cavalieri’s Principle
Young mathematicians examine area of different figures with the same cross-sectional lengths and work up to volumes of 3D figures with the same cross-sectional areas. The instruction and the exercises stress that the two figures do not...
EngageNY
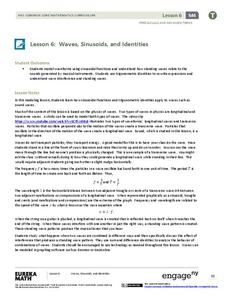
Waves, Sinusoids, and Identities
What is the net effect when two waves interfere with each other? The lesson plan answers this question by helping the class visualize waves through graphing. Pupils graph individual waves and determine the effect of the interference...
Other popular searches
- Math Lessons
- Halloween Math
- Thanksgiving Math
- Applied Math
- Christmas Math
- Math Puzzles
- Consumer Math
- Mathematicians
- Thanksgiving Math Worksheets
- Math Functions
- Mathematics
- Math Measurement


