Flipped Math
Frequency Tables
What's the association? Pupils watch a presentation on creating a two-way frequency table. Learners find out how to calculate relative frequencies within the table to determine whether there is an association between the two categories....
CK-12 Foundation
Bar Graphs, Frequency Tables, and Histograms: Comparing Heights
Become a master at creating visual displays. Using a provided list of heights, users of the interactive create a bar graph and a histogram. They answer a set of challenge questions based on these data representations.
EngageNY
Summarizing Bivariate Categorical Data in a Two-Way Table
Be sure to look both ways when making a two-way table. In the lesson plan, scholars learn to create two-way tables to display bivariate data. They calculate relative frequencies to answer questions of interest in the 14th part of the...
Willow Tree
Histograms and Venn Diagrams
There are many different options for graphing data, which can be overwhelming even for experienced mathematcians. This time, the focus is on histograms and Venn diagrams that highlight the frequency of a range of data and overlap of...
Mathed Up!
Cumulative Frequency and Box Plots
Learn how to display data. Young data analysts watch a video to review how to create cumulative frequency histograms and box plots. They work on a set of questions to practice producing these data displays.
Howard Hughes Medical Institute
Spreadsheet Tutorial 5: Histogram
A professional-looking histogram is just a few clicks away. The last installment of a five-part Spreadsheet Data Analysis series focuses on histograms. Learners work through a tutorial to see how spreadsheets can help make frequency...
Beyond Benign
Water Bottle Unit
How much plastic do manufacturers use to create water bottles each year? The class explores the number of water bottles used throughout the years to determine how many consumers will use in the future. Class members compare different...
Virginia Department of Education
Numbers in a Name
What's in a name? Pupils create a data set from the number of letters in the names of classmates. Each group then takes the data and creates a visual representation, such as a histogram, circle graph, stem-and-leaf plot, etc.
Rice University
Introductory Statistics
Statistically speaking, the content covers several grades. Featuring all of the statistics typically covered in a college-level Statistics course, the expansive content spans from sixth grade on up to high school. Material...
Flipped Math
Unit 5 Review: Bivariate Data
The data says it's a wrap. Pupils work through four review questions with multiple parts dealing with bivariate data. Questions cover creating and interpreting two-way tables and scatter plots with lines of best fit. Scholars finish up...
Mathed Up!
Histograms
Class members explore how to read and use histograms by watching a video on creating and analyzing histograms. To finish, the class works on a set of questions that tests these skills.
University of North Carolina
Modals
If you could have any job in the world, what would it be? Modal verbs such as could and would express possibility, as the installment of a compilation of informational handouts describes. A series of tables help explain the strength,...
Discovery Education
Sonar & Echolocation
A well-designed, comprehensive, and attractive slide show supports direct instruction on how sonar and echolocation work. Contained within the slides are links to interactive websites and instructions for using apps on a mobile device to...
National Security Agency
Starting a Restaurant
Through an engaging unit, chefs-in-training will sort and classify data using tally charts. Learners will also create bar graphs to display restaurant data and interpret data from bar graphs using a variety of categories....
Science Geek
The Dual Nature of the Electron
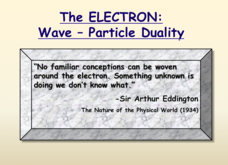
Why don't atoms collapse? Scientists debated this concept for years before they understood the dual nature of the electron. Presentation discusses the electron as both a particle and an energy wave. It also relates these concepts to the...
Utah Education Network (UEN)
Microwave Magic
The microwave is a staple in many American households, but how exactly does it work? Approach this question from a scientific and practical standpoint, and discover cooking strategies, recipes, and methodologies for the standard...


