Flipped Math
Graphing Functions to Solve Equations
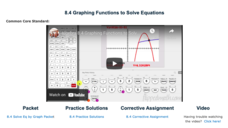
Intersections become solutions. Scholars watch a video on using a graphing calculator to find the solution to an equation in one variable. While watching the presentation, pupils practice working some of the examples and compare their...
West Contra Costa Unified School District
Graphing Piecewise Functions
Step up to learn about step functions. The lesson, designed for high schoolers, first covers piecewise functions and how to draw their graphs. It then introduces step functions, including the greatest integer (floor) and...
Teach Engineering
Graphing Equations on the Cartesian Plane: Slope
Slopes are not just for skiing. Instructors introduce class members to the concept of slope and teach them how to calculate the slope from a graph or from points. The lesson also includes the discussion of slopes of parallel and...
EngageNY
Identifying Proportional and Non-Proportional Relationships in Graphs
Graph a relationship to find out if it is proportional. The instructional activity introduces the criteria for determining whether a relationship is a proportional relationship based on its graph. Pupils graph relationships and determine...
West Contra Costa Unified School District
Exploring Quadratics and Graphs
Young mathematicians first graph a series of quadratic equations, and then investigate how various parts of the equation change the graph of the function in a predictable way.
EngageNY
Some Facts About Graphs of Linear Equations in Two Variables
Develop another way to find the equation of a line. The lesson introduces the procedure to find the equation of a line given two points on the line. Pupils determine the two points from the graph of the line.
Scholastic
Study Jams! Stem-and-Leaf Plots
Organizing data doesn't have to be boring when you introduce stem and leaf plots to the lesson. In a step-by-step interactive lesson, learners can see how to put data into one of these plots and easily see any patterns. Included are test...
EngageNY
Introduction to Simultaneous Equations
Create an understanding of solving problems that require more than one equation. The lesson introduces the concept of systems of linear equations by using a familiar situation of constant rate problems. Pupils compare the graphs of...
Teach Engineering
Complex Networks and Graphs
Show your class how engineers use graphs to understand large and complex systems. The resource provides the beginnings of graph theory by introducing the class to set theory, graphs, and degree distributions of a graph.
Chicago Botanic Garden
Historical Climate Cycles
What better way to make predictions about future weather and climate patterns than with actual climate data from the past? Young climatologists analyze data from 400,000 to 10,000 years ago to determine if climate has changed over...
Berkshire Museum
Camouflage!: Collecting Data and Concealing Color
Help young scholars see the important role camouflage plays in the survival of animals with a fun science lesson. Starting with an outdoor activity, children take on the role of hungry birds as they search for worms represented by...
Institute of Electrical and Electronics Engineers
Coloring Discrete Structures
What's the least number of colors needed to color a U.S. map? The lesson begins by having pupils view a video clip on continuous and discrete phenomenon, then launches into an activity reminiscent of Zeno's paradox. A separate video...
Mathematics Vision Project
Module 2: Systems of Equations and Inequalities
The brother-sister pair Carlos and Clarita need your class's help in developing their new pet sitting business. Through a variety of scenarios and concerns presented to the siblings, the learners thoroughly explore systems of equations...
EngageNY
Another Computational Model of Solving a Linear System
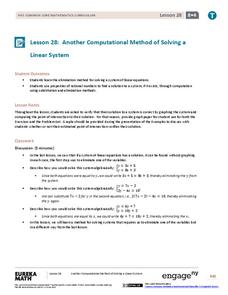
The process of elimination really works! Use elimination when substitution isn't doing the job. The 29th segment in a series of 33 introduces the elimination method to solving linear systems. Pupils work several exercises to grasp the...
National Research Center for Career and Technical Education
Break-Even Point
How do companies determine the prices of their products? Marketing maestros discover the concepts of cost and break-even point through discussion, independent practice, and a collaborative assessment. The career and technology-oriented...
Shodor Education Foundation
InteGreat
Hands-on investigation of Riemann sums becomes possible without intensive arithmetic gymnastics with this interactive lesson plan. Learners manipulate online graphing tools to develop and test theories about right, left, and...
University of Northern Texas
Continuity
Continue a study of calculus by using a slideshow to introduce the concept of continuity. After defining the term, the presentation provides examples of functions that are discontinuous and introduces different types...
Manitoba Education and Early Childhood Learning
A Foundation for Implementation
Color is the focus of this amazing resource packed with math, social studies, science, and language arts activities. Kids create a color word wall and post symbols, graph the number of objects they find of each color while on a...
Teach Engineering
Processes on Complex Networks
Introduces your class to random processes in networks with an activity that uses information about disease spread using the susceptible, infectious, resistant (SIR) model. Participants determine whether a susceptible person becomes...
EngageNY
Increasing and Decreasing Functions 2
Explore linear and nonlinear models to help your class build their function skills. In a continuation of the previous lesson, learners continue to analyze and sketch functions that model real-world situations. They progress from linear...
Workforce Solutions
Miniature Gulf Coast Project
Scholars show what they know about data collection and analysis with an activity that examines a smaller population of Houghton, Texas. Independently or in pairs, learners identify their research question, gather, graph, and analyze...
Illustrative Mathematics
The Intersection of Two Lines
Here is an introduction to solving simultaneous linear equations. Start by drawing a line through two points. Create a second line which goes through the intersecting point. Background knowledge of how to find the equation of a line and...
Illustrative Mathematics
Introduction to Linear Functions
Introduce your algebra learners to linear and quadratic functions. Learners compare the differences and relate them back to the equations and graphs. Lead your class to discussions on the properties of a function or a constant slope...
Teach Engineering
Android Acceleration
Prepare to accelerate your Android. Pupils prep for the upcoming activity in this third installment of a four-part series. The lesson progresses nicely by first introducing different types of acceleration to the class. The teacher...


