Virginia Department of Education
What's the Point?
Point your class in the right direction in plotting points with three activities that give scholars a chance to learn about and practice plotting points on a coordinate plane. They draw figures on the coordinate plane and list out the...
Teach Engineering
Coordinates and the Cartesian Plane
The plot thickens to get a functional understanding. After a short review of plotting points on the coordinate plane, class members learn the difference between functions and relations in the second lesson in a series of nine. They...
CK-12 Foundation
Ordered Pairs in Four Quadrants
One quadrant just isn't enough. Pupils learn to plot points in the four quadrants of a coordinate plane using an interactive. A set of challenge questions tests their understanding of the skill.
PBS
Plotting Pairs of Coordinate Points in all Four Quadrants to Construct Lines
Here is a instructional activity on coordinates that has pupils view three Cyberchase video clips illustrating the definition of "point" and "line." Along the way, learners will discuss what characters from the videos do, and where...
All-in-One High School
Elements of Plot
Cinderella wants to go to the ball and marry the prince. At the end of the story, she does! But how does the plot move from the exposition to the resolution? Teach language arts learners and fairy tale fans about the basics of plot...
Mabry MS Blog
Scatter Plots
Scatter plots are a fun way to gather and collect relevant data. The presentation goes through several examples and then describes the different types of correlation.
Willow Tree
Scatterplots and Stem-and-Leaf Plots
Is there a correlation between the number of cats you own and your age? Use a scatter plot to analyze these correlation questions. Learners plot data and look for positive, negative, or no correlation, then create stem-and-leaf plots to...
Willow Tree
Line Plots
You can't see patterns in a jumble of numbers ... so organize them! Learners take a set of data and use a line plot to organize the numbers. From the line plot, they find minimum, maximum, mean, and make other conclusions about the...
Prezi
Song of the Trees by Mildred Taylor
Explore the literary elements of Mildred Taylor's Song of the Trees with this beautiful Prezi presentation. Focusing on the story's characters, setting, and major plot points, young readers are provided with a complete summary of...
Mathed Up!
Cumulative Frequency and Box Plots
Learn how to display data. Young data analysts watch a video to review how to create cumulative frequency histograms and box plots. They work on a set of questions to practice producing these data displays.
National Council of Teachers of Mathematics
Geogebra: Residuals and Linear Regression
If the line fits, use it. Using a Geogebra interactive, pupils plot points and try to find the best fit line. They assess the linear fit by analyzing residuals. A radio button allows participants to show the regression line and the...
Curated OER
Birds' Eggs
More than just data, scatter plots are full of information that can be used to answer a variety of questions. This lesson uses a plot with information about bird egg sizes to answer questions about the relationship between length and...
Willow Tree
Box-and-Whisker Plots
Whiskers are not just for cats! Pupils create box-and-whisker plots from given data sets. They analyze the data using the graphs as their guide.
Project Maths
Correlation Coefficient
Of course, there might be a correlation! Young mathematicians investigate several different data sets, create scatter plots, and determine any correlation. They consider whether a causation exists between any of the variables in question.
EngageNY
Mid-Unit Assessment: Analyzing Point of View and Plot Development in Flush
It's the halfway point—there's no turning back now. Scholars work on the mid unit assessment for Flush. For the assessment, learners analyze the point of view and plot development by annotating the text using sticky notes and underlining...
EngageNY
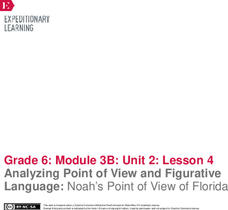
Analyzing Point of View and Figurative Language: Noah’s Point of View of Florida
Fishing for words. Scholars search for unfamiliar words in pages 27-29 of Flush, place them in their word catchers, and complete part of Noah’s Point of View graphic organizer. After identifying figurative language, learners analyze...
CK-12 Foundation
Plots of Polar Coordinates: Submarine Sonar
Find the location of enemy submarines with a sonar display that doubles as a polar coordinate system. Pupils find polar coordinates that would be the same location of plotted submarines. They then determine multiple polar...
EngageNY
Drawing the Coordinate Plane and Points on the Plane
To plot a point in the coordinate plane, you first need a coordinate plane. Pupils learn to draw an appropriate set of axes with labels on a coordinate plane. They must also determine a reasonable scale to plot given coordinate pairs on...
Curated OER
Calculate the Slope of a Line Using Two Points
Find that slope! This video does an excellent job of demonstrating how to use the slope formula to find the slope of a line using two points. The instructor first reviews the definition of slope of a line, then works three problems using...
EngageNY
Linear Equations in Two Variables
Create tables of solutions of linear equations. A lesson has pupils determine solutions for two-variable equations using tables. The class members graph the points on a coordinate graph.
Novelinks
The Lightning Thief: Concept/Vocabulary Analysis
Before you begin reading Percy Jackson and the Lightning Thief by Rick Riordan, read over this comprehensive handout that gives you a plethora of information regarding the story's summary, organizational structure, central...
Charleston School District
Graphing Functions
How do letters and numbers create a picture? Scholars learn to create input/output tables to graph functions. They graph both linear and nonlinear functions by creating tables and plotting points.
EngageNY
Ordered Pairs
Scholars learn to plot points on the coordinate plane. The activity introduces the idea that the first coordinate of a coordinate pair represents the horizontal distance and the second coordinate represents the vertical distance.
EngageNY
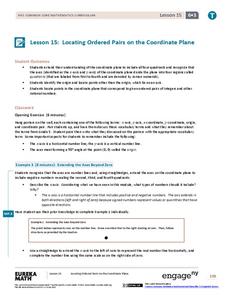
Locating Ordered Pairs on the Coordinate Plane
Four quadrants, four times the fun. Future mathematicians learn the terminology associated with the coordinate plane and how to plot points in all four quadrants. A worksheet tests their understanding of the material in the 16th...
Other popular searches
- Plotting Coordinates Picture
- Plotting Points Pictures
- Fun Plotting Points
- Plotting Points on Graphs
- Plotting Coordinates Maps
- Plotting Coordinates on Maps
- Plotting Points on a Graph
- Plotting Coordinates Graphs
- Plotting Points on a Grid
- Plotting Points Math
- Ell Math Plotting Points


