BW Walch
Creating and Graphing Linear Equations in Two Variables
This detailed presentation starts with a review of using key components to graph a line. It then quickly moves into new territory of taking these important parts and teasing them out of a word problem. Special care is...
Mathed Up!
Distance Time Graphs
If only there was a graph to show the distance traveled over a period of time. Given distance-time graphs, pupils read them to determine the answers to questions. Using the distance and time on a straight line, scholars calculate the...
Teach Engineering
Graphing Equations on the Cartesian Plane: Slope
Slopes are not just for skiing. Instructors introduce class members to the concept of slope and teach them how to calculate the slope from a graph or from points. The lesson also includes the discussion of slopes of parallel and...
Beyond Benign
Municipal Waste Generation
Statistically, waste may become a problem in the future if people do not take action. Using their knowledge of statistics and data representation, pupils take a look at the idea of waste generation. The four-part unit has class members...
Mathed Up!
Scatter Graphs
Make an estimate by getting in line. The class works with scatter plots and lines of best fit to make an estimate for given values. Pupils determine whether there is a positive or negative correlation and draw a best-fit line. Using the...
EngageNY
Interpreting, Integrating, and Sharing Information: Using Charts and Graphs about DDT
Is American growing fatter? Scholars begin with a mini lesson on reading charts and graphs using information about Human Body Fat in United States. They then transfer what they learned to charts and graphs using harmful and...
CPO Science
Physics Skill and Practice Worksheets
Stop wasting energy searching for physics resources, this comprehensive collection of worksheets has you covered. Starting with introductions to the scientific method, dimensional analysis, and graphing data, these skills practice...
NASA
The Big Climate Change Experiment Lesson 3: Climate Change Lines of Evidence
Consider the preponderance of evidence when making a verdict. The third of five lessons in Unit 1: The Big Climate Change Experiment focuses on the evidence for climate change. Learners study graphs, diagrams, and pictures regarding...
Baylor College
Living Things and Their Needs: The Math Link
Enrich your study of living things with these cross-curricular math activities. Following along with the story Tillena Lou's Day in the Sun, learners will practice addition and subtraction, learn how to measure volume and length,...
Illustrative Mathematics
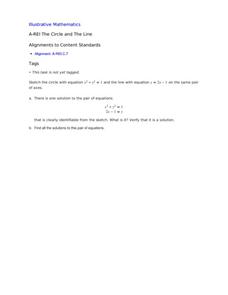
The Circle and The Line
Here is a resource where algebra learners show their understanding of a system of equations involving a circle and a line. Once graphed, learners see two points of intersection, one where the ordered pair is read, and a second where...
EngageNY
Modeling Linear Relationships
Math modeling is made easy with the first installment of a 16-part module that teaches pupils to model real-world situations as linear relationships. They create graphs, tables of values, and equations given verbal descriptions.
Mathed Up!
Inequalities Regions
Discover how to solve systems of inequalities by graphing. An informative video shows pupils how to determine the solution set after graphing each inequality of a system. To finish, a worksheet gives them a chance to practice this skill.
Curated OER
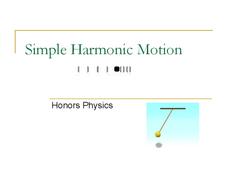
Simple Harmonic Motion
Back and forth, and back again. A presentation on harmonic motion would make a great backdrop for a directed instruction lesson in Honors Physics. It includes diagrams, formulas, graphs, and a few sample problems.
EngageNY
Real-World Positive and Negative Numbers and Zero
Class members investigate how positive and negative numbers are useful in the real world. Individuals first read a short passage and identify terms indicating positive and negative numbers. They consider situations involving positive...
K12 Reader
Absolute Location
Where in the world are we? As a reading comprehension exercise, kids read a short passage about navigation using latitude and longitude, and then respond to a series of questions based on the article.
Sinclair Community College
Solving Linear Inequalities
Your learners will appreciate the complete picture of linear inequalities presented in this lesson plan. Starting simply with definitions and moving all the way to solving linear inequality word problems this activity is simple to...
Teach Engineering
Forms of Linear Equations
Linear equations are all about form. The fifth part in a unit of nine works with the different equivalent forms of linear equations. Class members become familiar with each form by identifying key aspects, graphing, and converting...
West Contra Costa Unified School District
Introduction to Solving Linear Inequalities in One Variable
Life isn't fair ... like inequalities. After first reviewing inequality symbols and how to read inequality statements, learners discover how to solve one-step inequalities and graph their solution sets.
Houghton Mifflin Harcourt
Nature Walk: English Language Development Lessons (Theme 2)
Walking in nature is the theme of a unit designed to support English language development lessons. Scholars look, write, speak, and move to explore topics such as camping, woodland animals, instruments,...
Texas State Energy Conservation Office
Investigation: Kinetic and Potential Energy
A well-developed lab sheet guides physical science learners through an investigation of kinetic and potential energy. In small groups, collaborators discover whether or not the ramp height or mass of an object has an effect on the...
Rice University
Introductory Statistics
Statistically speaking, the content covers several grades. Featuring all of the statistics typically covered in a college-level Statistics course, the expansive content spans from sixth grade on up to high school. Material...
Mathed Up!
Frequency Polygons
Frequency polygons are a different way to represent frequencies over intervals. Pupils take frequencies for intervals of data from a frequency table and plot them as a frequency polygon. Budding mathematicians find information about the...
Curriculum Corner
7th Grade Math "I Can" Statement Posters
Translate the Common Core math standards into a series of achievable "I can" statements with this collection of classroom displays. Offering posters for each standard, this resource is a great way to support your seventh graders as...
Curriculum Corner
8th Grade Math "I Can" Statement Posters
Clarify the Common Core standards for your eighth grade mathematicians with this series of classroom displays. By rewriting each standard as an achievable "I can" statement, these posters give students clear goals to work toward...


