National Security Agency
Line Plots: Frogs in Flight
Have a hopping good time teaching your class how to collect and graph data with this fun activity-based lesson series. Using the provided data taken from a frog jumping contest, children first work together...
PBS
Shakespeare & The Renaissance: Activity Ideas
Looking for ways to implement the words and works of William Shakespeare into your curriculum? This list of activity ideas is a great starting point, as it covers a wide range of grade levels and a wealth of online references to explore.
Science Matters
Plot Study
Small groups investigate plots of land to discover how abiotic and biotic factors interact. After recording their findings, scholars share observations with peers and self-reflect on the learning process.
Virginia Department of Education
Scatterplots
Math is all fun and games with this activity! Learners use an activity designed around hula hoops to collect data. They create scatter plots with their data and then analyze the graphs for correlation.
Scholastic
A Reading Guide to A Wrinkle in Time
Accompany a reading of Madeleine L'Engle's classic tale, A Wrinkle in Time, with a detailed guide equipped with 15 informative and useful chapters. Scholars discover who the author is, why she wrote the book, and crucial story elements...
Mascil Project
Sports Physiology and Statistics
If I want to build up my heart, where should I start? Science scholars use statistics in a sports physiology setting during an insightful experiment. Groups measure resting and active heart rates and develop a scatter plot that shows the...
Core Knowledge Foundation
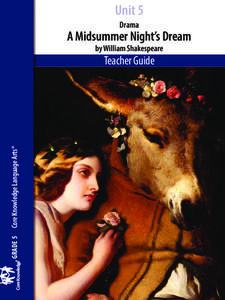
Unit 5: A Midsummer Night’s Dream
Fifth graders analyze William Shakespeare's A Midsummer Night's Dream, paying close attention to character development, plot, and dialogue. With daily reading and thoughtful discussion, scholars take pen to paper to respond to journal...
Curated OER
Flicking Football Fun
Young mathematicians fold and flick their way to a deeper understanding of statistics with a fun, hands-on math unit. Over the course of four lessons, students use paper footballs to generate data as they learn how to create line...
Curated OER
Button Bonanza
Collections of data represented in stem and leaf plots are organized by young statisticians as they embark some math engaging activities.
Statistics Education Web
Text Messaging is Time Consuming! What Gives?
The more you text, the less you study. Have classes test this hypothesis or another question related to text messages. Using real data, learners use technology to create a scatter plot and calculate a regression line. They create a dot...
Radford University
Sleep and Teen Obesity: Is there a Correlation?
Does the number of calories you eat affect the total time you sleep? Young mathematicians tackle this question by collecting their own data and making comparisons between others in the class through building scatter plots and regression...
Penguin Books
A Teacher's Guide to the Signet Classics Edition of Charles Dickens's Great Expectations
Instructors expect great things from a good teacher's guide, and this one delivers. The 48-page guide to Charles Dickens's Great Expectations provides information about plot developments and new characters and places introduced in...
Virginia English Bulletin
Book Trailer Projects From Classroom to Community
Invite your pupils to express their understanding of a novel through a collaborative video project. Groups choose a novel from those you have studied in class, select four scenes, storyboard the scenes, film the scenes, edit the film,...
Teach Engineering
Understanding the Air through Data Analysis
Is there a correlation or causation relationship between air pollutants? Groups develop a hypothesis about the daily variation of air pollutants, specifically ozone and CO2. Using Excel to analyze the data, the groups evaluate their...
Radford University
Are We Normal?
Develop a sense of normal. Learners develop two questions to ask classmates to gather numerical data before creating a box and whisker plot and a histogram to display their data. Class members make inferences and investigate the data...
Radford University
Box-and-Whisker Activity
Think inside the box. Working in small groups, pupils design a study to answer comparing two data sets. Team members collect data and construct box-and-whisker plots and analyze them to prove or disprove their hypothesis. They develop...
Teach Engineering
A New Angle on PV Efficiency
Let me get an angle on this! Investigate the orientation of a photovoltaic panel and its effect on efficiency. By using a light source, learners collect and plot current output to determine the ultimate orientation. The resource includes...
National Security Agency
What’s Your Coordinate?
Your middle schoolers will show what they know with their bodies when they become the coordinate plane in this conceptual development unit. Starting with the characteristics of the coordinate plane, learners develop their skills by...
Kenan Fellows
Saving Those Who Save Us: Exploring the Use of Sensors with Data Visualization
Sensor technology is amazingly accurate and useful. Combining the sensor technology and mathematical knowledge, scholars design experiments to answer a question they have developed. Questions may focus on light sensing, temperature...
Roald Dahl
Fantastic Mr. Fox
A fancifully illustrated guide to Roald Dahl's Fantastic Mr. Fox, this series of lessons, activities, and tasks could be used in its entirety or picked apart and used piecemeal. Have young readers investigate the role of dialogue in...
Radford University
Environmental Issues
Pupils investigate the air pollution situation in China by fitting a curve to historical data. They dig deeper into environmental issues that are of interest and provide a mathematical analysis of the issue. Class members develop a route...
Radford University
Animal Decline
Where did they all go? Small groups collect data on different animal species that are on a decline. Teams develop equations to model the populations over time and then create presentations about the decline of their animals. Classmates...
American Statistical Association
What is the Probability of “Pigging Out”
Learners apply their understanding of luck to a probability experiment. They play a game of Pass the Pigs to determine the probability of a specific outcome. Using analysis for their data, pupils declare the measures of center, dot...
Scholastic
A Reading Guide to Sarah, Plain and Tall
Eliminate the hard work of creating an entire literature unit with this reading guide for the novel Sarah, Plain and Tall. From background information about the author and her motivation for writing the story to...
Other popular searches
- Character and Plot Development
- Reading Plot Development
- Stages of Plot Development
- Analyze Plot Development
- Plot Development Art
- Stories Plot Development
- Plot Development in Writing
- Writing, Plot Development
- Plot Development Lesson
- Writing Plot Development


