National Security Agency
Line Plots: Frogs in Flight
Have a hopping good time teaching your class how to collect and graph data with this fun activity-based lesson series. Using the provided data taken from a frog jumping contest, children first work together...
Science Matters
Plot Study
Small groups investigate plots of land to discover how abiotic and biotic factors interact. After recording their findings, scholars share observations with peers and self-reflect on the learning process.
Core Knowledge Foundation
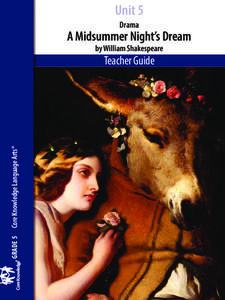
Unit 5: A Midsummer Night’s Dream
Fifth graders analyze William Shakespeare's A Midsummer Night's Dream, paying close attention to character development, plot, and dialogue. With daily reading and thoughtful discussion, scholars take pen to paper to respond to journal...
Curated OER
Flicking Football Fun
Young mathematicians fold and flick their way to a deeper understanding of statistics with a fun, hands-on math unit. Over the course of four lessons, students use paper footballs to generate data as they learn how to create line...
Dr. Seuss Enterprises
Dr. Seuss in the Classroom
Explore the works of Dr. Seuss, such as Horton Hears a Who, Horton Hatches and Egg, The Sneetches and Other Stories, The Lorax, The Butter Battle Book, and Yertle the Turtle and Other Stories. Each story lesson includes reading...
Curated OER
Volcanoes: Sixth Grade Lesson Plans and Activities
Bring a set of pre-lab, lab, and post-lab lesson plans on volcanoes to your earth science unit. Sixth graders explore the three types of volcanoes found on Earth, plot the specific locations of these volcanoes on a map, and...
Statistics Education Web
Text Messaging is Time Consuming! What Gives?
The more you text, the less you study. Have classes test this hypothesis or another question related to text messages. Using real data, learners use technology to create a scatter plot and calculate a regression line. They create a dot...
Teach Engineering
Understanding the Air through Data Analysis
Is there a correlation or causation relationship between air pollutants? Groups develop a hypothesis about the daily variation of air pollutants, specifically ozone and CO2. Using Excel to analyze the data, the groups evaluate their...
Radford University
Sleep and Teen Obesity: Is there a Correlation?
Does the number of calories you eat affect the total time you sleep? Young mathematicians tackle this question by collecting their own data and making comparisons between others in the class through building scatter plots and regression...
Discovery Education
Sonar & Echolocation
A well-designed, comprehensive, and attractive slide show supports direct instruction on how sonar and echolocation work. Contained within the slides are links to interactive websites and instructions for using apps on a mobile device to...
Radford University
Are We Normal?
Develop a sense of normal. Learners develop two questions to ask classmates to gather numerical data before creating a box and whisker plot and a histogram to display their data. Class members make inferences and investigate the data...
National Security Agency
What’s Your Coordinate?
Your middle schoolers will show what they know with their bodies when they become the coordinate plane in this conceptual development unit. Starting with the characteristics of the coordinate plane, learners develop their skills by...
NOAA
The Oceanographic Yo-yo
How does chemistry help deep-sea explorers? Part four of a five-part series of lessons from aboard the Okeanos Explorer introduces middle school scientists to technologies used in ocean exploration. Groups work together to analyze data...
Radford University
A Change in the Weather
Explore the power of mathematics through this two-week statistics unit. Pupils learn about several climate-related issues and complete surveys that communicate their perceptions. They graph both univariate and bivariate data and use...
Roald Dahl
Fantastic Mr. Fox
A fancifully illustrated guide to Roald Dahl's Fantastic Mr. Fox, this series of lessons, activities, and tasks could be used in its entirety or picked apart and used piecemeal. Have young readers investigate the role of dialogue in...
National Park Service
Fire Ecology on the Rim
An engaging unit on wildfires includes three sections, including a background section with eight lessons and five activities, a field experience section with 13 lessons and five activities, and a conclusion section featuring an...
Friends of Fort McHenry
British Attacks in the Chesapeake during the War of 1812
This is a fun mapping activity that will have your class knowing the ins and outs of the battles in the War of 1812. Your young cartographers will not only plot decisive attacks, but will analyze their purpose, goals, and impact on...
Teach Engineering
A New Angle on PV Efficiency
Let me get an angle on this! Investigate the orientation of a photovoltaic panel and its effect on efficiency. By using a light source, learners collect and plot current output to determine the ultimate orientation. The resource includes...
California Department of Education
Roadmap to Success
Life is a highway ... where will yours lead? Scholars pave the way toward success in the fourth of five college and career readiness lesson plans. Using the SMART system, individuals begin mapping out the steps they will follow to...
American Statistical Association
What is the Probability of “Pigging Out”
Learners apply their understanding of luck to a probability experiment. They play a game of Pass the Pigs to determine the probability of a specific outcome. Using analysis for their data, pupils declare the measures of center, dot...
National Wildlife Federation
What is DBH?
When measuring the circumference of a tree, does it matter how high you place the measuring tape? Most scholars have never considered this question, but scientists know that measurement techniques must be standardized. The 13th lesson in...
Math by Design
Transformations – Reflections
Scholars use interactive resources to figure out how to mathematically draw a reflection of a geometric shape viewed in a mirror. To conclude the activity, class members are asked to deduce the result of multiple reflections across...
American Statistical Association
Armspans
Young mathematicians collect data on the arm spans of classmates. Then they sort the data by measures of center, spread, and standard deviation. Finally, they compare groups, such as boys and girls, to interpret any differences.
Ideas From Suzi
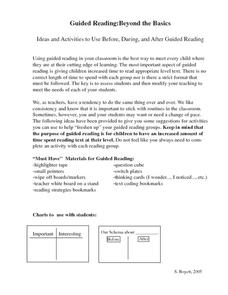
Guided Reading: Beyond the Basics
Elevate children's reading comprehension skills with this collection of guided reading resources. From paper dice with basic comprehension questions printed on them to a system for using sticky notes to identify key...


