West Contra Costa Unified School District
Comparing Data Displays
There is so much more to data than just numbers, and this resource has learners use three methods of comparing data in a multi-faceted lesson. The 21-page packet includes a warm-up, examples, an activity, and assessment for a complete...
EngageNY
Linear Equations in Two Variables
Create tables of solutions of linear equations. A activity has pupils determine solutions for two-variable equations using tables. The class members graph the points on a coordinate graph.
EngageNY
Introduction to Simultaneous Equations
Create an understanding of solving problems that require more than one equation. The lesson introduces the concept of systems of linear equations by using a familiar situation of constant rate problems. Pupils compare the graphs of...
Scholastic
Study Jams! Double-Digit Division
RJ had an awesome basketball season this year! Use division by double-digit numbers to calculate his scoring average in this instructional presentation. Starting with an explanation of the terms dividend, divisor, and quotient, the long...
Scholastic
Study Jams! Mean/Average
Join Zoe as she calculates the average number of points RJ scored in his basketball games. This step-by-step presentation clearly models the procedure for finding the mean of a data set, including examples with both whole number and...
EngageNY
Conducting a Simulation to Estimate the Probability of an Event II
Add some randomization into simulations. The 11th installment in a series of 25 presents two new methods to use in simulations--colored disks, and random numbers. Pupils use random numbers to run simulations where the probabilities make...
EngageNY
Creating a Histogram
Display data over a larger interval. The fourth segment in a 22-part unit introduces histograms and plotting data within intervals to the class. Pupils create frequency tables with predefined intervals to build histograms. They describe...
Egmont
H.O.R.S.E.
Extend your lesson on Christopher Myers' H.O.R.S.E with a series of activities about basketball. After kids read the book, they match basketball terms with their definitions, find as many words as they can with the letters H, O, R, S,...
Montana Office of Public Instruction
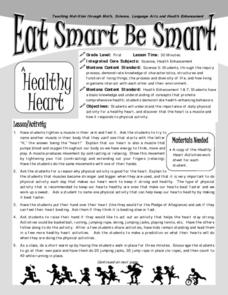
Eat Smart Be Smart
Get children's blood pumping with this primary grade lesson on the human heart. After learning about the important role this muscle plays in the human body, learners monitor their heart rates and discover the importance of staying active.
Willow Tree
Data Sampling
Some say that you can make statistics say whatever you want. It is important for learners to recognize these biases. Pupils learn about sample bias and the different types of samples.
Curated OER
One-Variable Inequality Word Problems
Here is a great set of eight scenarios that require the writing of a one-variable inequality and then solving to find the solution. This inequality word problem activity is then followed by the solutions to each of the eight problems.
Willow Tree
Circle Graphs
Pie isn't just for eating! Scholars learn to create pie charts and circle graphs to represent data. Given raw data, learners determine the percent of the whole for each category and then figure out the degree of the circle that percent...
EngageNY
Describing a Distribution Displayed in a Histogram
The shape of the histogram is also relative. Learners calculate relative frequencies from frequency tables and create relative frequency histograms. The scholars compare the histograms made from frequencies to those made from relative...


