Virginia Department of Education
Independent and Dependent Variables
Investigate the relationship between independent and dependent variables. Individuals begin by identifying independent and dependent variables from different problem situations. Then, using specific guidelines, they create posters...
EngageNY
Problems in Mathematical Terms
Whether scholars understand independent and dependent variables depends on you. The 32nd installment of a 36-part series has learners analyze relationships in real-world problems through tables. They determine independent and dependent...
EngageNY
Multi-Step Problems in the Real World
Connect graphs, equations, and tables for real-world problems. Young mathematicians analyze relationships to identify independent and dependent variables. These identifications help create tables and graphs for each situation.
EngageNY
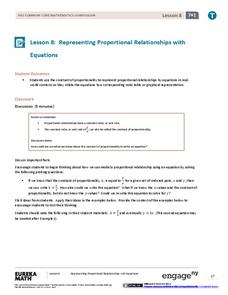
Representing Proportional Relationships with Equations
Use the constant of proportionality to relate the independent variable to the dependent variable. The eighth installment of a 22-part series instructs pupils to use the equation to find the constant of proportionality and then write the...
EngageNY
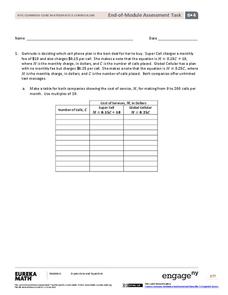
End-of-Module Assessment Task: Grade 6 Math Module 4
Finish out the module with a bang. The last installment of a 36-part module is an end-of-module assessment task. Test takers set up equations to represent relationships and solve problems in an assortment of contexts.
Concord Consortium
Graphing Elements
How do you graph a sentence? Scholars do just that as they represent relationships between independent and dependent variables with a graphical representation. Given a sentence, they determine the pertinent relationship and create a...
Balanced Assessment
Bathtub Graph
Represent the relationship between independent and dependent variables through a modeling situation. The activity expects learners to graph the volume of water in a bathtub during a given scenario. The graph should result in two areas of...
Shodor Education Foundation
Two Variable Function Pump
Use a function to operate on two variables. Pupils look at operating with complex numbers as a function of two variables. The interactive squares the input and adds a constant to it. Learners visualize the resulting output and its...
Shodor Education Foundation
Scatter Plot
What is the relationship between two variables? Groups work together to gather data on arm spans and height. Using the interactive, learners plot the bivariate data, labeling the axes and the graph. The resource allows scholars to create...
New York City Department of Education
Dance and Text
Use texts and dances to teach inequalities and equations. A sixth-grade unit covers using variables in equations and inequalities to solve problems. Learners show what they know at the end of the unit using two performance tasks, one...
CK-12 Foundation
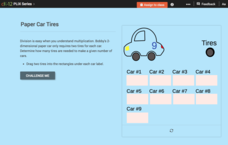
Single Variable Division Equations: Paper Car Tires
Don't tire of solving equations, mix up your lesson! A virtual interactive has users drag paper tires to toy cars. Solving a one-step equation lets them find how many cars can be made from a given number of tires.
Balanced Assessment
Books from Andonov
To examine mathematical functions in a modeling situation pupils combine quadratic and step functions to represent a presented scenario. They both graph and write a function to represent data shown in a table.
CK-12 Foundation
Determining the Equation of a Line: Temperature Conversion Challenge
Line up the temperature conversions. Pupils create the linear function between Celsius and Fahrenheit on a graph by plotting the freezing and boiling points of water. The scholars determine how the relationship changes based upon...
Creative Learning Exchange
Lesson Plans From The Lorax
When it comes to the environment, no variable is constant. Class members graph behavior over time for the thneeds produced over truffula trees chopped down over the course of Dr. Seuss's The Lorax.
EngageNY
Linear Models
Expand your pupils' vocabulary! Learn how to use statistical vocabulary regarding linear models. The lesson teaches scholars the appropriate terminology for bivariate data analysis. To complete the module, individuals use linear...
Noyce Foundation
Gym
Give the class a mental work out with an assessment task in which young mathematicians compare several gym membership options. They use substitution to calculate the cost for given numbers of months.
Noyce Foundation
Truffles
Knowing how to scale a recipe is an important skill. Young mathematicians determine the amount of ingredients they need to make a certain number of truffles when given a recipe. They determine a relationship between ingredients given a...
Virginia Department of Education
Road Trip
Help plan a road trip with linear equations. Scholars consider two different rental car companies and write equations representing the cost for each company. They graph the system of equations to determine the conditions under which each...
Balanced Assessment
Function or Not?
Is it possible for an equation to be a function and not a function at the same time? By completing a short assessment, young mathematicians answer this question. Class members provide an explanation on how an equation represents a...
EngageNY
Factoring Expressions
Factor in an informative resource when teaching about factoring. The 11th activity in a 36-part module shows pupils how to factor algebraic expressions by applying the distributive property. Some of the problems involve expressions with...
EngageNY
Mid-Module Assessment Task: Pre-Calculus Module 5
Determine if any reteaching with a mid-module assessment task. The assessment covers the general multiplication rule, permutations and combinations, and probability distributions for discrete random variables.
California Education Partners
Speedy Texting
Model the effects of practice on texting speed. Pupils develop a linear equation that models the change in texting speed based on the amount of practice. The sixth performance task in an eight-part series requires learners to solve...
Shodor Education Foundation
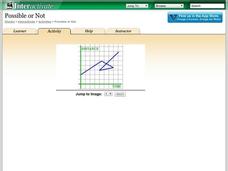
Possible or Not?
What does the graph mean? Pupils view 10 graphs and determine whether they are possible based on their contexts. The contexts are distance versus time and profit versus time.
Concord Consortium
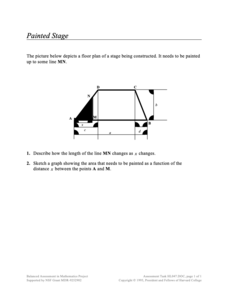
Painted Stage
Find the area as it slides. Pupils derive an equation to find the painted area of a section of a trapezoidal-shaped stage The section depends upon the sliding distance the edge of the painted section is from a vertex of the trapezoid....


