EngageNY
Discrete Random Variables
You don't need to be discreet about using the resource on discrete variables. In the fifth installment of a 21-part module, scholars explore random variables and learn to distinguish between discrete and continuous random variables. They...
EngageNY
Solution Sets to Equations with Two Variables
Can an equation have an infinite number of solutions? Allow your class to discover the relationship between the input and output variables in a two-variable equation. Class members explore the concept through tables and graphs and...
Virginia Department of Education
Independent and Dependent Variables
Investigate the relationship between independent and dependent variables. Individuals begin by identifying independent and dependent variables from different problem situations. Then, using specific guidelines, they create posters...
CK-12 Foundation
Misleading Graphs (Identify Misleading Statistics): Are Virgos Cursed?
Is it safe to take data at its face value? Pupils use the interactive to evaluate a claim that Virgos are more likely to get into a car crash than others. Individuals determine whether another variable may be at play.
EngageNY
Relationships Between Two Numerical Variables
Working in small groups and in pairs, classmates build an understanding of what types of relationships can be used to model individual scatter plots. The nonlinear scatter plots in this activity on relationships between two numerical...
EngageNY
Mid-Module Assessment Task: Grade 8 Module 4
Determine what the class knows about linear equations. The three-question mid-module assessment is segment 15 in a 33-part series. The assessment includes writing and solving one-variable linear equations and graphing proportional...
Illustrative Mathematics
Identifying Exponential Functions
Class members have the opportunity to quickly change the variables of an exponential graphs through the use of sliders on Desmos. Four graphs are given and young mathematicians, through the use of the graphing app, can discover which...
CK-12 Foundation
Graphs of Systems of Linear Inequalities in Two Variables: President Jefferson's Octagonal Home
Mathematically complete a set of blueprints. Using eight linear inequalities, pupils create a blueprint of Thomas Jefferson's home. Individuals graph the linear inequalities and position the solution of the inequalities before...
Flipped Math
Create and Analyze Graphs
Model the world with graphs. Pupils watch and participate in creating graphs to model real-world situations. The presenters stress the importance of a consistent scale and proper labels for the graphs along with identification of the...
Flipped Math
Calculus AB/BC - Introduction to Optimization Problems
Let's get the equation set. Pupils see the importance of setting up an one-variable equation in the first of two lessons on optimization problems. The presenter works four different types of problems before individuals use the included...
EngageNY
Solving Basic One-Variable Quadratic Equations
Help pupils to determine whether using square roots is the method of choice when solving quadratic equations by presenting a lesson that begins with a dropped object example and asks for a solution. This introduction to solving by...
EngageNY
Multi-Step Problems in the Real World
Connect graphs, equations, and tables for real-world problems. Young mathematicians analyze relationships to identify independent and dependent variables. These identifications help create tables and graphs for each situation.
Balanced Assessment
Bathtub Graph
Represent the relationship between independent and dependent variables through a modeling situation. The activity expects learners to graph the volume of water in a bathtub during a given scenario. The graph should result in two areas of...
California Education Partners
Speedy Texting
Model the effects of practice on texting speed. Pupils develop a linear equation that models the change in texting speed based on the amount of practice. The sixth performance task in an eight-part series requires learners to solve...
Mr. Waynes clas
Kinematics Objectives
Accelerate young physicists' learning with this collection of problem-solving worksheets. Starting off by teaching students to identify the given information and variables in physics problems, this resource goes on to challenge them...
PBS
Working with Coordinate Planes: Assessments
It's time for scholars to show what they know about coordinate planes with a collection of three assessments. The exams' objectives include plotting points on a single grid, measuring using the distance formula, and identifying...
Flipped Math
Experimental Design
Experimentally, come up with a study design. Learners hear about different types of study designs, observational studies, and experiments. They identify the subjects, response variable, treatment, and whether there was a cause and...
Mr. Science
The Scientific Method
First, ask a question and then, do research. Next, form a hypothesis, and conduct an experiment. Make observations, gather and analyze data, and then state a conclusion based on the results. This is the scientific method, and here is a...
EngageNY
Solution Sets to Inequalities with Two Variables
What better way to learn graphing inequalities than through discovering your own method! Class members use a discovery approach to finding solutions to inequalities by following steps that lead them through the process and...
EngageNY
Writing and Evaluating Expressions—Multiplication and Division
Don't table the resource on writing expressions for relationships in tables. Scholars investigate relationships between variables and write algebraic expressions involving multiplication and division. These expressions help solve...
Math Mammoth
Solving Quadratic Equations by Finding Square Roots
For this quadratic equation worksheet, students solve equations by identifying the square roots. They identify all possible solutions. Twenty problems are provided on this one-page worksheet.
EngageNY
The Graph of a Linear Equation—Horizontal and Vertical Lines
Graph linear equations in standard form with one coefficient equal to zero. The lesson plan reviews graphing lines in standard form and moves to having y-coefficient zero. Pupils determine the orientation of the line and, through a...
Federal Reserve Bank
Your Budget Plan
What do Whoosh and Jet Stream have in common? They are both characters in a fantastic game designed to help students identify various positive and negative spending behaviors. Through an engaging activity, worksheets, and...
National Wildlife Federation
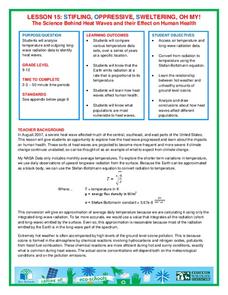
Stifling, Oppressive, Sweltering, Oh My!
Looking for a hot date? Pick any day in August, statistically the hottest month in the United States. The 15th lesson in the series of 21 instructs pupils to investigate the August 2007 heat wave through NASA data, daily temperature...


