Arizona Department of Education
Introduction to Integers
Welcome to the backward world of negative numbers. This introductory lesson teaches young mathematicians that negative numbers are simply the opposite of positive numbers as they use number lines to plot and compare...
Inside Mathematics
Population
Population density, it is not all that it is plotted to be. Pupils analyze a scatter plot of population versus area for some of the states in the US. The class members respond to eight questions about the graph, specific points and...
Inside Mathematics
Snakes
Get a line on the snakes. The assessment task requires the class to determine the species of unknown snakes based upon collected data. Individuals analyze two scatter plots and determine the most likely species for five...
Shodor Education Foundation
Regression
How good is the fit? Using an interactive, classmates create a scatter plot of bivariate data and fit their own lines of best fit. The applet allows pupils to display the regression line along with the correlation coefficient. As a final...
Shodor Education Foundation
Data Flyer
Fit functions to data by using an interactive app. Individuals plot a scatter plot and then fit lines of best fit and regression curves to the data. The use of an app gives learners the opportunity to try out different functions to see...
Math Worksheets Land
Halloween Cartesian Art: Bat
Get the class batty over graphing. Young mathematicians plot ordered pairs in all quadrants of a Cartesian plane, and connect the points to create a bat.
Math Drills
Christmas Cartesian Art Santa
Santa has his eye on you in a graphing activity that has young mathematicians plot ordered pairs on a Cartesian plane. After joining the points together, a picture of jolly Santa Claus comes to life.
Student Handouts
Beginning-Middle-End Chart
Track the plot of a book with a straightforward chart. Pupils write in the title of the book and then note down what happened at the beginning, middle, and end of the story.
Math Drills
Christmas Cartesian Art Snowflake
A festive math worksheet hones graphic skills and keeps the season bright! Young mathematicians join points in the order they were graphed to create a snowflake picture.
Curriculum Corner
I See a School
Enthusiastic readers report on a book detailing what it's about and their favorite part with a picture-based writing template. A nonfiction version takes a step further to highlight what the pupil learned, and a fiction version showcases...
Curated OER
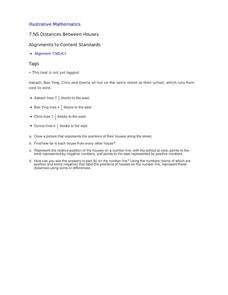
Distances Between Houses
This resource sneaks in the math so your learners will be adding and subtracting positive and negatives on a number line while thinking they are mapping out houses. The activity starts by putting houses the appropriate distance away from...
Florida Center for Reading Research
Comprehension: Narrative Text Structure, Story Pieces
An activity boosts reading comprehension by challenging scholars to answer questions about a narrative tale detailing elements—plot, characters, setting, theme, problem, and solution.
Math Drills
Christmas Cartesian Art Tree
Spruce up graphing practice with an activity that has young mathematicians plot points on a coordinate plane, and then connect the points to create a Christmas tree.
Math Drills
Halloween Cartesian Art: Witch Hat
What is the mystery picture? After plotting points on the first quadrant of a Cartesian coordinate system, young mathematicians connect the points to create a Halloween-themed picture.
Curated OER
Which is Closer to 1?
A seemingly simple question that reveals a lot about a student's understanding of fractions. In finding an answer, learners compare fractions with different denominators that are both greater and less than one. No number line is...
Curated OER
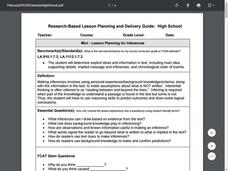
Mini-Lesson Planning for Inferences
Making inferences and drawing conclusions is a key component to successful active reading. Encourage your class to use context clues and prior knowledge to infer different elements of a story, including the setting, plot, and character...
Mathematics Assessment Project
Middle School Mathematics Test 3
Real-life mathematics is not as simple as repeating a set of steps; pupils must mentally go through a process to come to their conclusions. Teach learners to read, analyze, and create a plan for solving a problem situation. The...
Balanced Assessment
Cost of Living
Math scholars investigate the cost of living in Hong Kong compared to Chicago but must first convert the different types of currency. They then choose a type of graph to compare different spending categories and finish the activity by...
Yummy Math
Deflate-gate
Does temperature affect the air pressure of a football? Young mathematicians look at the readings from a pressure gauge and determine if the balls are within regulation or are under inflated.
K12 Reader
Points on a Coordinate Grid
Introduce your class to the basics of coordinate planes. The reading passage included here describes ordered pairs and the different quadrants on a coordinate grid. Learners read the passage and respond to five related questions.
Grandview Independent School District
Study Guide So B. It
Pair these comprehension questions with a study of So B. It by Sarah Weeks. There are two to six questions listed for each chapter, and space is provided for pupils to write responses. The questions are continuous, so it would make most...
Curated OER
Drive the Data Derby
Three days of race car design and driving through the classroom while guessing probability could be a third graders dream. Learn to record car speed, distances traveled, and statistics by using calculation ranges using the mean, median,...
Curated OER
Point Reflection
Use this task as an exit ticket for your eight graders during the geometry unit. All they need to do is identify the coordinates of a point reflected over y=2000.
Curated OER
Jon and Charlie's Run
Let's use math to solve an argument. Jon and Charlie are debating about who can run farther, but who is right? That's what your class will figure out as they apply their understanding of fractions to this real-life situation. A simple,...


