Illustrative Mathematics
How Many Cells Are in the Human Body?
Investigating the large numbers of science is the task in a simple but deep activity. Given a one-sentence problem set-up and some basic assumptions, the class sets off on an open-ended investigation that really gives some context to all...
EngageNY
Tides, Sound Waves, and Stock Markets
Help pupils see the world through the eyes of a mathematician. As they examine tide patterns, sound waves, and stock market patterns using trigonometric functions, learners create scatter plots and write best-fit functions.
Illinois Valley Community College
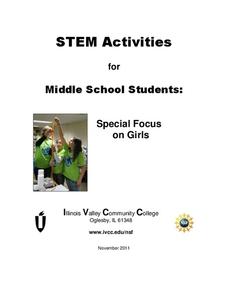
STEM Activities for Middle School Students
Use STEM activities within the class to provide connections to concepts. The resource includes activities that range from working with buoyancy to building rockets and launching them. Other activities involve the engineering design...
Howard Hughes Medical Institute
Spreadsheet Tutorial 4: t-Test
The t-test tutorial will fit your needs to a T. After calculating the mean, sum of squares, standard deviation, and variance of two data sets on a spreadsheet, scholars learn to calculate the t-values. They then learn to use the TTEST...
Howard Hughes Medical Institute
Spreadsheet Tutorial 3: Column Graphs, Error Bars, and Standard Error of the Mean
There's absolutely no error in using the tutorial! Learners use spreadsheets to create column or bar graphs with error bars. They also learn how to calculate the standard error of the mean in the tutorial. This is the third installment...
Howard Hughes Medical Institute
Spreadsheet Tutorial 2: Autofill Data, Cell References, and Standard Deviation
If you've always wanted to know more about spreadsheets, here's a perfect resource for you. A self-paced tutorial introduces how to autofill and copy formulas in a Google sheet or Excel spreadsheet. It also shows users how to find range,...
Howard Hughes Medical Institute
Spreadsheet Tutorial 1: Formulae, Functions, and Averages
Spread your knowledge of spreadsheets. The first of five tutorials in the Spreadsheet Data Analysis unit introduces the basics of spreadsheets. It shows future data analysts how to organize and format tables, and how to use functions to...
Kenan Fellows
Applying Linear Regression to Marathon Data
It's not a sprint, it's a marathon! Statistic concepts take time to develop and understand. A guided activity provides an opportunity for individuals to practice their linear regression techniques in spreadsheet software. The activity...
Kenan Fellows
Let's Move
Find a statistical reason for a fresh start. Using a hypothetical scenario, individuals research statistical data of three different cities. Their goal? Find the best statistical reason for a business to move to a new location. Their...
Kenan Fellows
Using Motion Sensors to Explore Graph Sketching
Get moving to a better understanding of graphs of derivatives. Using motion sensors, scholars vary their velocities to create graphs of the first derivative of a function. The activity challenges groups to first create a script of the...
Kenan Fellows
Man vs. Beast: Approximating Derivatives using Human and Animal Movement
What does dropping a ball look like as a graph? An engaging activity asks learners to record a video of dropping a ball and uploading the video to software for analysis. They compare the position of the ball to time and calculate the...
EngageNY
TASC Transition Curriculum: Workshop 15
What do a cheetah, Audi commercial, and air have in common? They're all topics of an engaging inquiry-based, hands-on workshop for educators about background knowledge, reading strategies, the CER model, and argumentative writing. The...
Mascil Project
Epidemics: Modelling with Mathematics
The Black Death epidemic is responsible for more than one million deaths in the United Kingdom. An inquiry-based activity has young scholars explore the rate of disease spread. They then analyze graphs showing data from epidemics such as...
Concord Consortium
Gestation and Longevity
Is the gestation length of an animal a predictor of the average life expectancy of that animal? Learners analyze similar data for more than 50 different animals. They choose a data display and draw conclusions from their graphs.
Rice University
Introductory Statistics
Statistically speaking, the content covers several grades. Featuring all of the statistics typically covered in a college-level Statistics course, the expansive content spans from sixth grade on up to high school. Material comes from a...
Curated OER
Where in the World Am I: Latitude And Longitude
Pupils demonstrate their knowledge in using latitude and longitude measurements to find locations on a map, especially places in Hawaii.
Curated OER
Mitosis And the Cell Cycle
Students determine the approximate time a cell spends in each phase of mitosis by counting cells in each phase from a prepared slide. They use a few simple calculations to estimate how long cells spend in each cycle in the body.
Curated OER
Graphing And Data Presentation
Pupils engage in a study of science and mathematics with the practice of creating graphs. A guest speaker comes to the class to share statistics from the community and the students are shown how he uses the coordinate system in the real...
Curated OER
Where Am I, and How Do I Get Where I am Going?
Students describe geographical places through art, music, writing, and math. They compile information in booklets which may be published.
Curated OER
Lotto or Life: What Are the Chances?
Though the website does not seem to have the mentioned video, a reding and lottery style games simulate the chances of finding intelligent life somewhere other than Earth. Without the video, this lesson is short, but it can be a useful...
Curated OER
Cyanobacteria Races: Cyanobacteria Motility Experiment for a Classroom
Students experiment to determine the effect of light on cyanobacteria movement. They graph the data of the experiment for further analysis. They watch a time-lapse video of cyanobacteria motility at a NASA website.
Curated OER
Graphing Iron Data
Students apply a data set to create a graph show how iron ore impacts an ecosystem. They explain how the iron effects the distribution and abundance of phytoplankton in coastal ecosystems using spreadsheet software.
Curated OER
Area, Surface Area and Volume of 3-D Shapes
Math whizzes examine the relationship between area and volume and the relationship between a 3-D shape and its surface area. Following discussion and practice, pupils participate in a project in which they design packaging for a new...
Curated OER
Word Problems & Comparison
In this comparison worksheet, students identify and complete 8 different problems that include comparing various scores and solving word problems. First, they use the table shown to compare test scores using the appropriate symbol. Then,...
Other popular searches
- Molecular Biology
- Plant Biology
- Biology Lab
- Biology Lesson Plans
- Biology Unit
- Introduction to Biology
- Population Biology
- Biology Crossword
- Biology Calculus
- Biology Vocabulary
- Ap Biology
- Biology Lab Photosynthesis


