Teach Engineering
Statistical Analysis of Flexible Circuits
Scholars connect statistical analysis with flexible electric circuits. They first learn about flexible circuits and their applications through a PowerPoint presentation and then consider how the fabrication process for these circuits...
Curated OER
Planet Data
Sixth graders use various resources to locate information for a database (name of planets, diameter of planets, etc.). They enter the data onto a prepared data grid. Use of Access to sort data is accented within this lesson. Students...
Curated OER
What Can Data Tell Us?
Students analyze data they have collected themselves and by their classmates. In groups, they create data distributions to identify the highest, lowest and middle values. As a class, they discuss the concept of sample size and how it can...
Curated OER
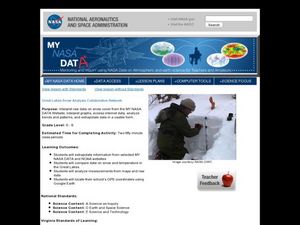
Great Lakes Snow Analysis Collaborative Network
Young scholars interpret data on snow cover and analyze trend patterns. In this snow instructional activity students compare data and locate their school's GPS coordinates.
Chicago Botanic Garden
Plant Phenology Data Analysis
Studying data over time can paint a pretty interesting picture. Learners use data they collected in the previous lesson plan to compare to historical data in a similar region. They graph the data of the first bloom of a specific species...
Bonneville
Titanium Dioxide Raspberry Solar Cell Data Sharing
Concerned about how well others did on the experiment? Scholars share results from the titanium dioxide raspberry solar cell test they performed in the previous lesson. After analyzing the data, they come up with a claim about the...
Bonneville
Copper Oxide Cell Data Sharing
Sharing is caring—and good for learning, too. Learners share data from the experiment in the previous lesson by engaging in a gallery walk. They then consider and discuss the conditions under which a solar cell will have its maximum...
Curated OER
Ecosystems and Remote Sensing
Students obtain remote sensing data to compare and contrast global biomass data with global temperature data.
NASA
Erosion and Landslides
A professional-quality PowerPoint, which includes links to footage of actual landslides in action, opens this moving lesson. Viewers learn what conditions lead to erosion and land giving way. They simulate landslides with a variety of...
Curated OER
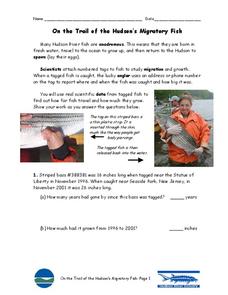
On the Trail of the Hudson's Migratory Fish
Ever wonder how scientists track fish underwater? Your class can learn how with this informative worksheet. First, they will read a paragraph about androgynous fish, tagging, and data analysis. Then, your scientists must answer five...
Curated OER
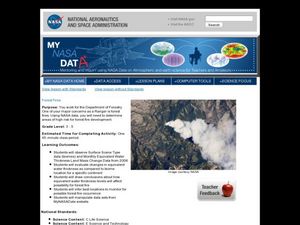
Forest Fires
Students play the role of a Ranger with the Department of Forestry. In this forest fires lesson, students examine data on biomes and images to determine high risk areas for forest fires to develop.
Curated OER
Cold, Clouds, and Snowflakes
Students explore satellite data and graphing. In this weather data analysis math and science instructional activity, students analyze NASA satellite data to draw conclusions about geographical areas where precipitation might have...
Curated OER
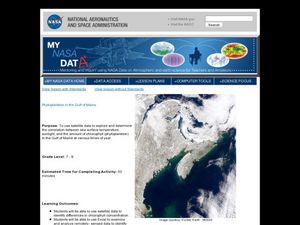
Phytoplankton in the Gulf of Maine
Students use satellite data to see the correlation between sea temperature and sunlight in the Gulf of Maine. In this phytoplankton lesson students use Excel to analyze data.
Beyond Benign
Municipal Waste Generation
Statistically, waste may become a problem in the future if people do not take action. Using their knowledge of statistics and data representation, pupils take a look at the idea of waste generation. The four-part unit has class members...
Curated OER
Creating Climographs
Young scholars use satellite data to compare precipitation and surface temperatures on different islands. In this satellite instructional activity students create graphs and explain the differences between weather and climate.
Howard Hughes Medical Institute
Lactase Persistence: Evidence for Selection
What's the link between lactase persistence and dairy farming? Biology scholars analyze data to find evidence of the connection, then relate this to human adaptation. Working individually and in small groups, learners view short video...
Curated OER
Blue Crabs - The Blue Crab's Chesapeake Journey
A plethora of information about the blue crabs of Chesapeake Bay will amaze and delight your marine biologists. They learn, through direct instruction, about the characteristics and life cycle of this fascinating arthropod. A highlight...
Howard Hughes Medical Institute
How to Analyze DNA Microarray Data
Unravel the complexities of DNA research. Analyzing DNA data can be a daunting, time-consuming task; however, as the lesson explains, an interactive importance of the research outweighs its complexities. The presentation breaks down the...
Curated OER
Are We Couch Potatoes or Busy Bees? Data Analysis of Physical Activity in School
Students study practical data analysis within the constraints of the scientific method. In this data lesson students collect and enter data into a computer spreadsheet then create graphs.
Curated OER
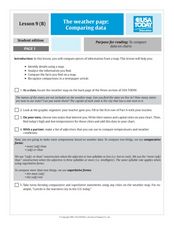
The Weather Page: Comparing Data
Students recognize the different types of data on the weather page of USA Today. For this weather lesson, students compare weather data comparative and superlative forms of adjectives. Students locate 10 pieces of information in the data...
Curated OER
The Weather Page-Comparing Data
Students examine weather patterns in the United States. For this weather lesson, students use a United States map to identify high and low temperatures in two states. Students compare the data and record their findings onto a chart.
Curated OER
States Of Matter
Delv into the states of Matter. Students engage in the scientific inquiry process to uncover the exciting world of Matter. They watch a series of videos, and conduct experiments in order to collect and analyze data on the various state...
Curated OER
The Southeast Anatolia Project
This resource is amazing. It is a full project including teacher notes, handouts, procedure, and worksheets. It introduces learners to the GAP project, a social environmental group working to bring irrigation, assistance, and increased...
Curated OER
Sending Messages to Space
Students interpret a message sent to space using a radio telescope and draw inferences from the interpreted message. Working with a partner, they interpret data that scientists believe is a message from aliens. They work on organizing...
Other popular searches
- Data, Census, & Statistics
- Data Analysis Pictograph
- Data Table
- Categorical Data
- Data Analysis Lesson Plans
- Data Management
- Data Analysis Graphing
- Data Analysis and Graphs
- Science Fair Project Data
- Data Display
- Organizing Data
- Census Data


