American Institutes for Research
Digital Smiles
Explore metric measurement, recording data, and creating an electronic spreadsheet displaying results with your math class. Scholars will measure the length of their smiles, record the measurements, and represent the results on an...
Curated OER
Mathematical Modeling
Study various types of mathematical models in this math lesson. Learners calculate the slope to determine the risk in a situation described. They respond to a number of questions and analyze their statistical data. Then, they determine...
Shodor Education Foundation
Measures
Take a look at data from a statistical lens. An interactive allows pupils to enter data set, labeling the data including the units used. Manipulating the applet, learners select the statistics to calculate that include total, mean,...
Rock A Lingua
Medios de Transporte/Means of Transportation
Make sure your pupils know how to get where they want to go! Learners can practice their Spanish vocabulary by completing these worksheets, which focus on modes of transportation and some grammar phrases for expressing going from one...
Math Learning Center
Fifth Grade Assessments and Scoring Checklists, Common Core State Standards
Check for understanding with a set of math assessments. Fifth graders answer questions involving multiplication and division, median and mode, rotational symmetry, and graphing.
University of Richmond
Canals 1820-1860
While canals are not a common mode of transportation today, they were part of the fuel for America's industrialization. However, most of them were located in the North, also feeding regional differences and sectionalism. Using an...
Flipped Math
Unit 4 Review: One Variable Statistics
It's always nice to slow down and review. Scholars work on problems covering concepts on one-variable statistics. They create and interpret box plots and stem-and-leaf plots, determine the mean, median, mode, interquartile range, and...
Mathed Up!
Frequency Polygons
Frequency polygons are a different way to represent frequencies over intervals. Pupils take frequencies for intervals of data from a frequency table and plot them as a frequency polygon. Budding mathematicians find information about the...
K20 LEARN
You’re The Network: Data Analysis
How do you rate? Young scholars use graphical data to analyze ratings of different television episodes. Their analyses include best-fit lines, mean, median, mode, and range.
Radford University
Data Analysis Activity
What do classmates think? In groups, learners design surveys to investigate chosen topics. They conduct the survey, then analyze the results. As part of the activity, they must calculate the mean, median, mode, variance, and standard...
Utah Education Network (UEN)
Statistics
Find the value in analyzing data values. Statistics is the focus in the fifth of seven installments of the 6th Grade Math series. Individuals learn to examine dot plots, histograms, and box plots by considering the shape, mean, median,...
American Statistical Association
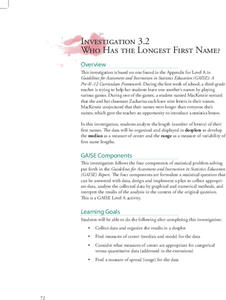
Who Has the Longest First Name?
Name that statistic! Classmates each write their name and the number of letters in it on a sticky note to place on the board. As a class, they determine the median, mode, and range of the name lengths, and create a dot plot of the data....
Curated OER
China's Population Growth
Learners collect data from China's population growth and determine the mean, median, and mode from the data. In this data lesson plan, pupils determine probabilities and use them to make predictions.
Hot Docs
Docs for School: Viewing and Teaching Guide
Teaching documentary in your class? Inform your instruction with a guide meant to support teachers as they begin with documentary. The resource includes information on what a documentary is as well as documentary modes, elements, and...
Curated OER
Mean, Median, Mode and Range Sheets
In this math worksheet, students use the graphic organizer to display their answers when learning about measures of central tendency. There are 4 boxes: mean, median, mode and range.
Edmond Public Schools
The Modes of Writing: How to Write for Different Purposes
Do your pupils know the difference between varying types of writing? This 57-slide presentation is made up of four sections: narrative writing, descriptive writing, expository writing, and persuasive writing. Split it up and use the...
Smarter Balanced
Growth and Expansion of America
Despite the difficulty of travel, the US expanded significantly between the 1800s and the early 1900s. To prepare for a performance task assessment on the rapid expansion of the US in the 1800s, class members engage in a...
Curated OER
Sound Walk: Discovering Data and Applying Range, Mode, and Mean
Elementary schoolers sharpen their listening skills as they use sound maps, tallies, and line plots to organize and interpret data. Everyone takes a "sound walk," and focuses on the sounds around them. They chart and tabulate the sounds...
Curated OER
Quantitative Data
In this quantitative data worksheet, pupils compute measures of central tendency, draw vertical line diagrams, and compare collected data. This 23-page worksheet contains approximately 100 multi-step problems. Explanations and examples...
Curated OER
Finding Your Way Around the World
Students plan a trip around the world and create a PowerPoint presentation of the journey. In this map, atlas, and technology lesson, students plan a trip around the world in which they avoid using an airplane. Students will consider...
Curated OER
Lesson #46: Bar Graphs and Line Graphs
In this bar graphs and line graphs activity, students interpret bar graphs, line graphs, and box-and-whisker plots. They find the measures of central tendency. This three-page activity contains notes, vocabulary, and...
Curated OER
Using Graphical Displays to Depict Health Trends in America's Youth
Identify the different types of graphs and when they are used. Learners will research a specific health issue facing teens today. They then develop a survey, collect and analyze data and present their findings in class. This is a...
Curated OER
ASL: Lesson 5
Sign language is an effective way to communicate with those special needs, hearing, impaired, and non-verbal pupils. This lesson plan provides a highly structured way to learn or teach ASL. Included are multiple links to images,...
PHET
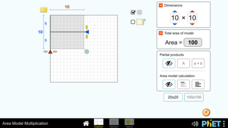
Area Model Multiplication
Develop a solid understanding of multiplication. The interactive provides opportunities for learners to continue building a deep understanding of multiplication. Pupils use the application to find the product of two numbers and find...
Other popular searches
- Mean, Median, Mode
- Modern
- Modern Dance
- Mean Median Mode
- Modern Art
- Array Model of Multiplication
- Bohr Model
- Modes of Transportation
- Dna Models
- Graphing Mean, Median, Mode
- Free Mean, Median, Mode
- Math; Mean, Median, Mode


