Omaha Zoo
I Like to Move It
What do lemurs do best? They move! Lemurs like to jump, run, hop, and climb and it's your class's job to document seven fun lemur behaviors. The class starts by discussing why lemurs are considered primates, and then they isolate seven...
Fort Bend Independent School District
Data Analysis - AP Statistics
What better way to study survey design than to design your own survey! Bring a versatile data analysis project to your AP Statistics class, and encourage them to apply the practices from their instructions to a real-world survey...
Teach Engineering
Energy Perspectives
The data says ... the resource is great to use. Using Microsoft Excel, pupils analyze data from the US Department of Energy in the fifth lesson of a 25-part Energy Systems and Solutions unit. Each group looks at a different data set and...
Education Development Center
Interpreting Statistical Measures—Class Scores
Explore the effect of outliers through an analysis of mean, median, and standard deviation. Your classes examine and compare these measures for two groups. They must make sense of a group that has a higher mean but lower median compared...
Shmoop
ELA.CCSS.ELA-Literacy.SL.9-10.2
What are diverse media formats? Have your class figure this out on their own through small-group brainstorming. The resource includes two related activities about different kinds of data that will help your class get a grasp of media...
Teach Engineering
Where Are the Plastics Near Me? (Field Trip)
With a piece of plastic here and a piece of plastic there, here a piece, there a piece, everywhere a piece. Teams go on a field trip in order to document the locations and kinds of plastic trash in an area near them. The eighth...
Mathematics Common Core Toolbox
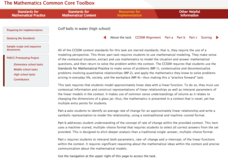
Golf Balls in Water
Here's a resource that models rising water levels with a linear function. The task contains three parts about the level of water in a cylinder in relationship to the number of golf balls placed in it. Class members analyze the data and...
Agile Mind
Isabella’s Credit Card
An in-depth activity that involves a real-world problem about credit card debt. Learners are given a scenario in which Isabella plans to stop using her credit card and pay off the balance by paying a fixed amount each month. The first...
DiscoverE
Waterproofing the Roof
Can your pupils build a roof that stands the test of time? Use an insightful engineering design project to highlight both materials science and architecture. Scholars either team up or work as individuals to design, create, and test a...
Howard County Schools
Planning for Prom
Make the most of your prom—with math! Pupils write and use a quadratic model to determine the optimal price of prom tickets. After determining the costs associated with the event, learners use a graph to analyze the break even point(s).
Personal Genetics Education Project
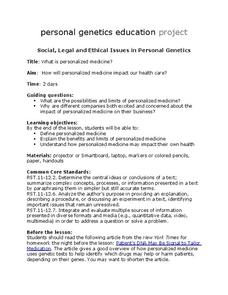
Personalized Medicine
Genetics learners read an article and watch a video about personalized medicine and the hope it holds for treating patients more specifically than doctors currently are able to. They research, design, and produce a brochure about the...
Shmoop
ELA.CCSS.ELA-Literacy.SL.11-12.2
One way to get your class to evaluate and synthesize multiple multimedia sources is through a research project. The idea here is that class members will watch videos and listen to scientific debates in order to create a casebook about...
Curated OER
Access Ramp
Just about every public building that your students are familiar with has an access ramp which complies with ADA requirements. As it turns out, designing such a ramp is an excellent activity to incorporate slope, the Pythagorean Theorem,...
Texas Instruments
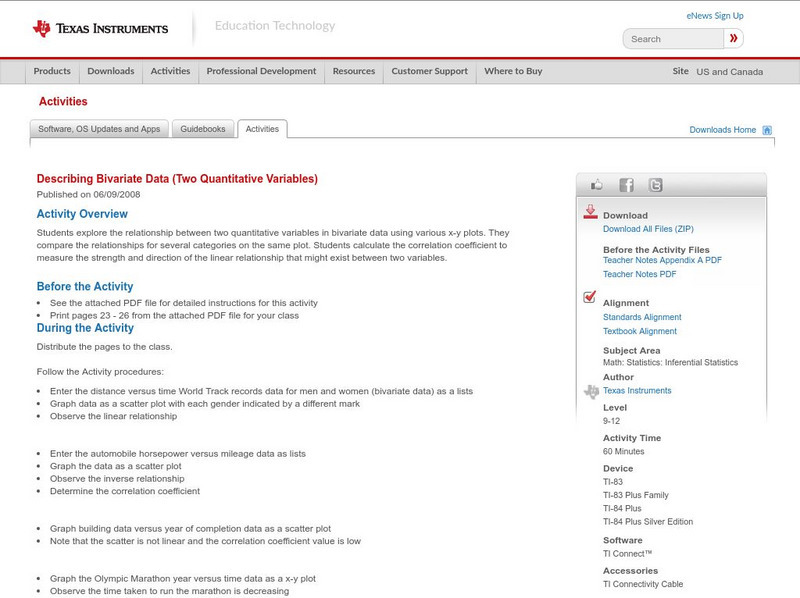
Texas Instruments: Describing Bivariate Data (Two Quantitative Variables)
Students explore the relationship between two quantitative variables in bivariate data using various x-y plots. They compare the relationships for several categories on the same plot. Students calculate the correlation coefficient to...
Discovery Education
Discovery Education: Science Fair Central: Investigation Set Up and Collect Data
A brief overview of how to gather both quantitative and qualitative data, complete with a sample data table.
University of Cambridge
University of Cambridge: Maths and Sports: Who's the Best?
Can you use data from the 2008 Beijing Olympics medal tables to decide which country has the most naturally athletic population? This data-handling activity encourages mathematical investigation and discussion and is designed to be...
Texas Instruments
Texas Instruments: How Do You Measure Up?
In this activity, students graph scatter plots to investigate possible relationships between two quantitative variables. They collect data and analyze several sets of data pairing the two quantities.
TeachEngineering
Teach Engineering: Where Are the Plastics Near Me? (Field Trip)
An adult-led field trip allows students to be organized into investigation teams that catalogue the incidence of plastic debris in different environments. These plastics are being investigated according to their type, age, location and...
Texas Instruments
Texas Instruments: Forensics Case 7 Drug Tests: Identifying an Unknown Chemical
In this activity, students distinguish between physical and chemical properties. They also understand the differences between qualitative and quantitative observations. They use quantitative and qualitative analyses to identify an...
TeachEngineering
Teach Engineering: Don't Confuse Your Qs!
Students investigate the difference between qualitative and quantitative measurements and observations. By describing objects both qualitatively and quantitatively, they learn that both types of information are required for complete...


