Utah Education Network (UEN)
Linear Graphs Using Proportions and Rates
Using a TI-73 or other similar graphing calculator middle school math majors investigate the linear relationship of equivalent proportions. After a brief introduction by the teacher, class members participate in a timed pair share...
Curated OER
Worksheet 14 - Rates
In this rate worksheet, students draw and label given situations, determine the rates and the relationship between them. This two-page worksheet contains 7 multi-step problems.
Curated OER
Physical and Chemical Reactions - Factors Which Affect Reaction Rate
A total of five experiments lead chemistry pros to understand the difference between physical and chemical change. They also experiment with exothermic reaction factors that affect rate of reaction. The procedures are not written in the...
Curated OER
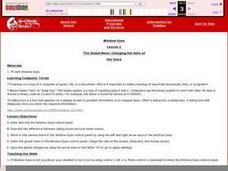
The Global Menu: Changing the Rate of the Voice
Students examine the Windows-Eyes control panel by using dialog boxes, pull-down menus, left and right arrow keys, and shortcut keys. They also change the rate of the screen, keyboard, and mouse voices.
Curated OER
Y-Intercept and Slope Intercept Form
Alegebra amateurs identify the slope and the y-intercept given a linear equation in slope-intercept form by correctly completing some in class problems. They write the linear equation in slope-intercept form that corresponds to the given...
Texas Instruments
Finding Linear Models Part III
Explore linear functions! In this Algebra I lesson, mathematicians graph data in a scatter plot and use a graphing calculator to find a linear regression and/or a median-median line. They use the model to make predictions.
Nuffield Foundation
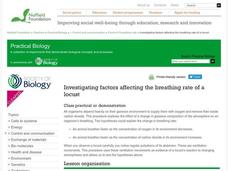
Investigating Factors Affecting the Breathing Rate of a Locust
Do animals breathe faster when given more oxygen or more carbon dioxide? Young scientists observe the respiration rates of locusts under a variety of gas concentrations to answer that very question. They collect data, analyze the...
EngageNY
Constant Rates Revisited
Find the faster rate. The resource tasks the class to compare proportional relationships represented in different ways. Pupils find the slope of the proportional relationships to determine the constant rates. They then analyze the rates...
Curated OER
Slope, Vectors, and Wind Pressure
A hands-on lesson using the TI-CBR Motion Detector to provide information to graph and analyze. The class uses this information to calculate the slope of motion graphs and differentiate scalar and vector quantities. There is a real-world...
EngageNY
Graphs of Simple Nonlinear Functions
Time to move on to nonlinear functions. Scholars create input/output tables and use these to graph simple nonlinear functions. They calculate rates of change to distinguish between linear and nonlinear functions.
California Mathematics Project
Meteorology
See how estimation is essential to making temperature weather maps. Scholars use ratios and rates of change to estimate temperatures at locations where temperature readings have not been made. They connect this idea to linear functions.
Curated OER
Dragonfly
The speed of a dragonfly brings math into the real world as your learners collaboratively see the value in calculating unit rates in direct proportion problems. This six-phase lesson plan encourages you, as the teacher, to only ask...
EngageNY
From Rates to Ratios
Look at rates from a general perspective. The 17th part of a 29-part series provides problems that help pupils develop more general ratios from given rates. Scholars determine unit rates and ratios that are associated with given rates....
Chicago Botanic Garden
Climate Change Around the World
Look at climate change around the world using graphical representations and a hands-on learning simulation specified to particular cities around the world. Using an interactive website, young scientists follow the provided directions to...
Curated OER
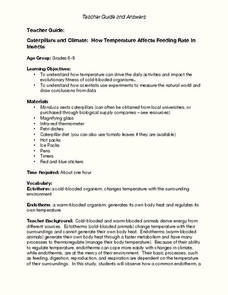
Caterpillars and Climate: How Temperature Affects Feeding Rate In Insects
Do you eat more when you are hot or when you are cold? Young scientists observe the eating pace of two caterpillars at different temperatures. The differences in endotherm and ecotherm animals' ability to adjust to temperature change...
Illustrative Mathematics
Cooking with the Whole Cup
Whoops! Travis accidentally put too much butter into the recipe. Your bakers must find out how to alter the recipe to accommodate different changes by using unit rates and ratios . The activity has multiple parts and calculations with...
Illustrative Mathematics
Chicken and Steak, Variation 2
Many organizations put on barbecues in order to make money. In a real-world math problem, the money allotted to purchase steak and chicken at this barbecue is only one hundred dollars. It is up to your potential chefs to figure out how...
Howard County Schools
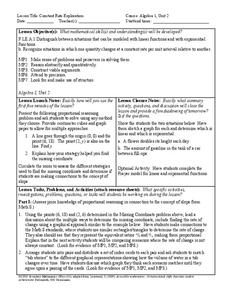
Constant Rate Exploration
Question: What do rectangles and bathtub volume have in common? Answer: Linear equations. Learn how to identify situations that have constant rates by examining two different situations, one proportional and one not proportional.
Virginia Department of Education
Thermochemistry: Heat and Chemical Changes
What makes particles attract? Here, learners engage in multiple activities that fully describe colligative properties and allow the ability to critically assess the importance of these properties in daily life. Young chemists conduct...
Virginia Department of Education
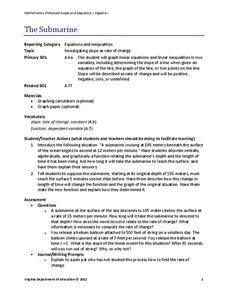
The Submarine
Submerge yourself in the study of slope. Scholars investigate a situation involving slope and the rate of change of a submarine. An additional example further explores the concept of slope by changing one of the conditions of the submarine.
Curated OER
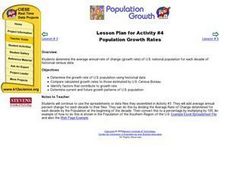
Population Growth Rates
Young scholars determine the average annual rate of change (growth rate) of U.S. national population for each decade of historical census data.
Curated OER
Reaction Time 2: Zap!
Learners explore critical thinking by conducting a reaction time experiment. In this human brain lesson, students utilize a timed Internet worksheet activity to research how fast their brain works when answering questions. Learners share...
American Chemical Society
Evaporation
This is one in several lessons that explore the relationship between temperature and phase changes of water. After some discussion, elementary physical scientists place wet paper toweling on a hot and a room-temperature water bag and...
Consortium for Ocean Science Exploration and Engagement (COSEE)
Ocean Acidification: Whats and Hows
Open this lesson by demonstrating the production of acidic carbon dioxide gas by activated yeast. Emerging ecologists then experiment with seashells to discover the effect of ocean acidification on shelled marine organisms. They measure...
Other popular searches
- Slope Rate of Change
- Constant Rate of Change
- Average Rate of Change
- Powerpoint Rate of Change
- Rate of Change Math
- Rate of Change Graphs
- Rate of Change Algebra
- Heart Rate Change
- Rate of Change Project
- Slope and Rate of Change
- Exchange Rate Changes
- Rate of Change" Tables


