EngageNY
Equivalent Ratios
Equivalent ratios show up on tape. Young mathematicians use tape diagrams to create equivalent ratios in the initial lesson on the topic. They learn the definition of equivalent ratios and use it to build others in the third segment of a...
EngageNY
Writing Addition and Subtraction Expressions
Symbols make everything so much more concise. Young mathematicians learn to write addition and subtraction expressions — including those involving variables — from verbal phrases. Bar models help them understand the concept.
Curated OER
Valentine's Day Quiz
In this filing in the blanks about Valentine's Day online/interactive worksheet, students read incomplete sentences and choose the words that correctly complete them. Students choose 10 multiple choice answers.
EngageNY
The Relationship of Division and Subtraction
See how division and subtraction go hand-in-hand. The fourth installment of a 36-part module has scholars investigate the relationship between subtraction and division. They learn using tape diagrams to see that they can use repeated...
Illustrative Mathematics
Sort and Count
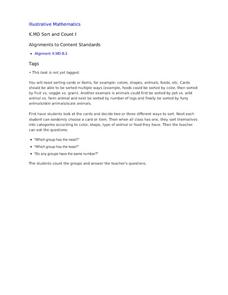
Young mathematicians are on their feet and moving around in this primary grade sorting activity. After giving each child an object or picture card, they then sort themselves into groups, counting to see which has the most or least...
Science Matters
Post-Assessment Energy
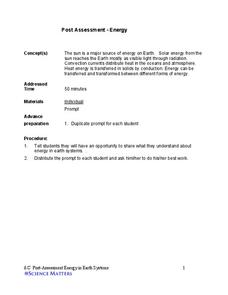
After nine lessons and activities about energy, here is the final assessment. The 20-questions include multiple choice, multiple choice with justification, short answer, answer analysis, and labeling diagrams to challenge learners.
Charleston School District
Review Unit 7: Real Numbers
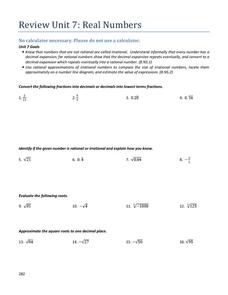
Provide pupils with problems to check their understanding of the concepts within the unit. The seven-part series of lessons covers concepts related to irrational numbers. Learners convert between fractions and decimals, estimate the...
Noyce Foundation
Ducklings
The class gets their mean and median all in a row with an assessment task that uses a population of ducklings to work with data displays and measures of central tendency. Pupils create a frequency chart and calculate the mean and median....
EngageNY
Solving Area Problems Using Scale Drawings
Calculate the areas of scale drawings until a more efficient method emerges. Pupils find the relationship between the scale factor of a scale drawing and the scale of the areas. They determine the scale of the areas is the square of the...
Other popular searches
- Diagramming Sentences Games
- Diagramming a Sentence
- Diagram Sentence
- Grammar Sentence Diagrams
- Color Coded Sentence Diagram
- Diagram Declarative Sentence
- Grammar Sentence Diagramming
- Diagramming Sentence
- Smart Board Sentence Diagram
- Sentence Diagram Grammar
- Sentence Diagrams Worksheets
- Sentence Diagram Gramme


