Curated OER
Impact!!
Pupils perform a science experiment. In this algebra lesson, students collect data from their experiment and create a graph. They analyze the graph and draw conclusion.
Curated OER
Local Traffic Survey
Students conduct a traffic survey and interpret their data and use graphs and charts to display their results.
Curated OER
Frequency Tables and Histograms
In this graph activity, 5th graders study the data presented on a bar graph. Students then respond to 4 short answer questions using the information that has been provided.
Curated OER
My Test Book: Stem and Leaf Plots
In this math skills worksheet, students solve 10 multiple choice math problems regarding stem and leaf plots. Students may view the correct answers.
Curated OER
Skittles, Taste the Rainbow
Fifth graders learn and then demonstrate their knowledge of a bar and a circle graph using the classroom data. Students are given a pack of skittles candy. Students create a bar and circle graph indicating the results of the contents of...
Curated OER
Dynamite Data
Second graders rotate through a variety of stations designed to offer practice in manipulating data. They sort, tally and count items and then create bar graphs, tables, and pie graphs to record their findings.
Curated OER
SkittleGraphs
Second graders discover how to make a bar graph. Each student receives a bag of Skittles candy. They make a bar graph which documents the colors found in the bag. At the end of the lesson plan, the Skittles are eaten. Fun!
Curated OER
Technology Literacy Challenge Grant Learning Unit
First graders explore counting and classification. They sort leaves, create graphs, write sentences for the data in the graphs, develop graphs for shapes, favorite animals, birthdays, and participate in a die prediction game.
Curated OER
Favorite Foods at Thanksgiving
Fourth graders study different types of graphs as a means of displaying information. They survey others to find their favorite Thanksgiving food and then graph the results using different types of graphs.
Curated OER
What's Your Line?
Fifth graders collect temperature readings over a period of time, enter the information into a spreadsheet and choose the appropriate graph to display the results.
Curated OER
Does Music Cam the Savage Beast?
Students collect, graph and analyze data. In this statistics lesson, students measure the heart beat of a person as they listen to music. They use the CBL and TI to create a graph, analyzing the outcome.
Curated OER
Loving Literature
First graders, after having "Are You My Mother?" by P.D. Eastman read to them, participate in group discussions or independentally work to analyze a spreadsheet to identify essential elements in the story and graph their data. In...
Curated OER
Money Circulation: A Story of Trade and Commerce
Learners are introduced to the meaning, symbolism, and value of the quarter. They determine the percentage of total monetary value held in quarters and graph the results. Students infer about the U.S. Mint's distrubution of coins. They...
Curated OER
Race Track (Culminating Activity)
Young scholars graph and solve linear equations. In this algebra activity, students use the slope and y-intercept to graph lines. They relate lines to the real world using different applications.
Curated OER
Quadratic Applications
In this quadratic applications worksheet, young scholars complete graphs, charts, comparison charts, and more having to do with quadratic equations. Students complete 5 different activities.
Curated OER
Gingerbread Man Math
Students collect and explore gingerbread man data. In this math and technology lesson plan, students examine how to organize and interpret data in three formats: objects, pictures, and graphs.
Curated OER
Skating Data
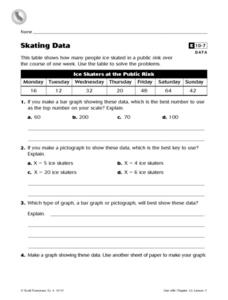
In this collecting data worksheet, 4th graders view a table on ice skaters at a public rink in order to answer 2 multiple choice questions, 1 short answer question and make a graph showing one piece of the data.
Curated OER
Songs from the Past
Students research songs from the past to learn about historical events. In this music history instructional activity, students conduct a survey on the Star-Spangled Banner, research the song and history on various websites, and research...
Curated OER
Bias in Statistics
Students work to develop surveys and collect data. They display the data using circle graphs, histograms, box and whisker plots, and scatter plots. Students use multimedia tools to develop a visual presentation to display their data.
Curated OER
Pounds of Paper
In this collecting of data instructional activity, 2nd graders study and analyze a pounds of paper table in order to solve and answer 6 mathematical questions.
Curated OER
Batting the Unknown
Pupils use batting averages to provide a measure of a player's past success. They use Algebra to calculate required performance to improve the average. Students compare baseball batting statistics early in the season and late in the...
Curated OER
And Now…the Supply Curve!
For this economics worksheet, students use their problem solving skills to respond to questions regarding the supply curve and its impact on an individual's lemonade stand business.
Curated OER
Parabolas
In this parabolas worksheet, 10th graders solve and graph 10 different problems that include various types of parabolas. First, they determine the vertex and the y-intercept for each problem given the information. Then, students write...
Curated OER
Integrated Algebra/Math A Regents Questions: Systems of Quadratic/Linear Equations
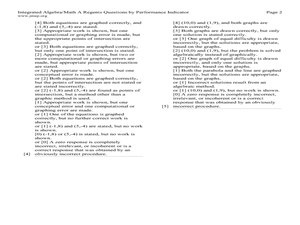
In this system of equations worksheet, students solve 5 graphing and short answer problems. Students graph quadratic and linear systems of equations to find the solutions to the system.


