Curated OER
Matter
Young scholars complete a unit of activities to learn about states of matter and how to measure matter. In this matter lesson, students complete 8 lessons to learn about matter, its states, and how to measure matter.
EngageNY
The Mean Absolute Deviation (MAD)
Is there a way to measure variability? The ninth resource in a series of 22 introduces mean absolute deviation, a measure of variability. Pupils learn how to determine the measure based upon its name, then they use the mean...
Mathematics Assessment Project
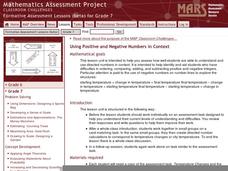
Using Positive and Negative Numbers in Context
Measure the temperature of your math class with a temperature-based lesson on adding and subtracting rational numbers. The thermometer serves as a vertical number line for learners as they work together to solve a temperature change...
Curated OER
Too Heavy For Me
Students explore the different arrangement of air molecules in high and low air pressure masses. They compare the temperature of high and low pressure masses and discover how a barometer works.
EngageNY
Describing Distributions Using the Mean and MAD
What city has the most consistent temperatures? Pupils use the mean and mean absolute deviation to describe various data sets including the average temperature in several cities. The 10th lesson in the 22-part series asks learners to...
Messenger Education
Cooling with Sunshades
Messenger's sun shade measures 8 ft x 6 ft and will have temperatures reaching 700 degree Fahrenheit on the outside while maintaining a cool 70 degrees underneath. In the third activity of four, groups discuss the basic properties of...
Space Awareness
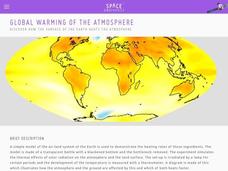
Global Warming of the Atmosphere
Scientists know the amount of carbon dioxide in the atmosphere today is higher than at any point in the last 800,000 years. Scholars learn about the amount of thermic radiation absorbed by air and what happens to the rest of the...
Illustrative Mathematics
Telling a Story With Graphs
Turn your algebra learners into meteorologists. Learners are given three graphs that contain information about the weather in Santa Rosa, California during the month of February, 2012. Graph one shows temperatures, graph two displays the...
Curated OER
Weather Instruments
Third graders practice making predictions about weather from conditions they observe on weather instruments and weather reports. Learners are introduced to the most basic weather reporting instruments: the thermometer, the wind vane, the...
Polar Trec
Do You See What Icy?
Here is a lesson that kicks off with a question. "How does ice floating on the ocean act as it melts?" As learners investigate this natural phenomenon, they'll discover that it has a lot to do with temperature, salinity, and the effect...
Curated OER
More on Conduction and Convection
Why do some items feel colder when they are the same temperature? How should you keep your soda cold? What makes the wind blow? These are just some of the things middle schoolers discover when completing a lesson on...
Curated OER
Does the Sidewalk Drink Puddles?
Young scholars participate in an experiment about evaporation. In this water cycle lesson plan, students use water, thermometers, and measuring tools to make a puddle and measure the size four times throughout the day. Young scholars...
Curated OER
What's in the Water? - Stream Side Science
Here is a complete activity in which young biologists or ecologists test the pH, dissolved oxygen, turbidity and temperature of stream water. The class visits an actual stream and makes observations of the site. They use scientific...
Curated OER
The Same, But Different Part II
Learners characterize a physical change as something that changes to a different size, but retains its basic substance. They measure volumes using milliliters, and perform an experiment that proves that gases expand when hot and contract...
Curated OER
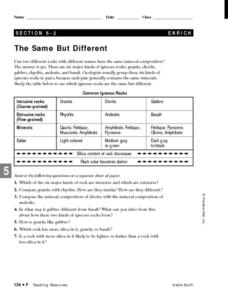
The Same, But Different
Third graders examine the phase change between solids and liquids and determine it to be a physical change. Ice is the perfect item to use to demonstrate this phase change. Pupils experiment with measuring and weighing solid ice and the...
LABScI
Freezing Point Depression: Why Don’t Oceans Freeze?
Can you go ice fishing in the ocean? Learners examine the freezing point of different saltwater solutions. Each solution has a different concentration of salt. By comparing the freezing points graphically, they make conclusions...
NASA
Supernova Chemistry
By measuring the wavelength, frequency, and intensity of electromagnetic radiation, scientists determine the temperature, density, and composition of far away items. Scholars rotate through ten lab stations using a spectroscope at each...
Institute of Electrical and Electronics Engineers
Keep it Cool
This cool lesson plan is ideal for elementary engineers or physical scientists, especially when learning about heat transfer and insulation. After reading a page of background information, engineering teams collaborate to design and...
Curated OER
As a Matter of Fact
Elementary-aged scientists discover that all matter has mass. They are shown the difference between mass and weight, and learn how to calculate mass using the appropriate tools and methods. The scientific method is used while estimating...
Curated OER
Water in Earth's Hydrosphere
Environmentalists test stream water for temperature, pH, and turbidity. Each group shares their information and then the class makes an overall evaluation of the water quality. A slide show sets the backdrop for the teaching portion and...
California Academy of Science
Climate Change Impacts
Getting kids thinking about climate change now, will hopefully push them into action when they become adults. Young environmentalists discuss the evidence and causes of climate change seen in the state of California. They brainstorm ways...
University of Texas
Lives of Stars
Stars exist from a few million years to over 10 billion years, depending on their mass. Scholars perform a play acting as stars to learn about their different life cycles. They develop an understanding of many of the fundamental concepts...
UAF Geophysical Institute
Carbon Footprint
Your young environmentalists can calculate their carbon footprint and discuss ways to reduce it with a worksheet about climate change. After reading a handout about what impact one's carbon footprint can have on the environment, kids...
Curated OER
Bringing Climate Change Into the Classroom
Students investigate the greenhouse effect and examine the potential effects of climate change in the Arctic. They construct a mini-greenhouse and test its effect on temperature, analyze historical climate statistics, and conduct an...


