Virginia Department of Education
Nonlinear Systems of Equations
Explore nonlinear systems through graphs and algebra. High schoolers begin by examining the different types of quadratic functions and their possible intersections. They then use algebraic methods to solve systems containing various...
EngageNY
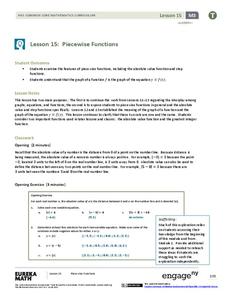
Piecewise Functions
Show your class members that if they can graph a linear function, they can graph an absolute value function. Groups create an absolute value graph using a table, then entertain the idea of an absolute value function defined as two...
Curated OER
Compound Inequalities and Graphing
Put geometry skills to the test! Learners solve compound inequalities and then graph the inequalities on a coordinate plane using their geometric skills. They identify the slope and y-intercept in order to graph correctly. I like this...
EngageNY
Using the Quadratic Formula
What is the connection between the quadratic formula and the types of solutions of a quadratic equation? Guide young mathematicians through this discovery as they use the discriminant to determine the number and types of solutions,...
Virginia Department of Education
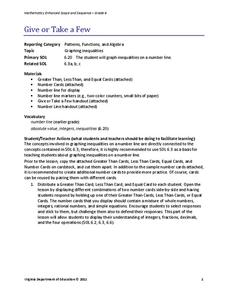
Give or Take a Few
Young mathematicians extend their knowledge of rational numbers on a number line to graph inequalities by first using number cards to compare rational numbers. They finish by using similar reasoning to graph inequalities on a number line.
Curated OER
Graphing Systems of Inequalities
Solve equations and graph systems of inequalities. Designed as a lesson to reinforce these concepts, learners revisit shading and boundaries along with solving linear inequalities.
University of North Texas
Graphing Piecewise Functions
Piecewise functions are the hodge-podge of algebra. Here, pupils watch as each graph is created and then pieced together to make a function. The first example creates a graph step-by-step, while the second problem posts a graph...
EngageNY
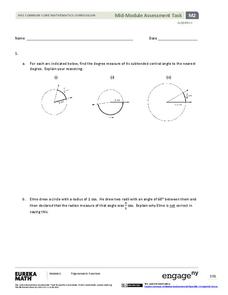
Algebra II Module 2: Mid-Module Assessment
Time for classes to show what they've learned. Use several tasks to assess understanding of the trigonometric functions, unit circle, radians, and basic trigonometric identities.
Illustrative Mathematics
Transforming the graph of a function
This activity guides learners through an exploration of common transformations of the graph of a function. Given the graph of a function f(x), students generate the graphs of f(x + c), f(x) + c, and cf(x) for...
Curated OER
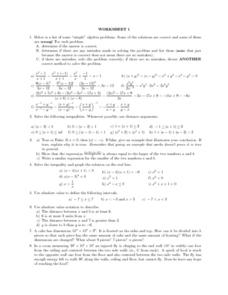
Worksheet 1: Algebra and Inequalities
Challenge your students' algebra skills with this activity, which presents students with several types of problem sets, including solving inequalities, graphing, word problems, and a set of algebra problems that may or may not require...
Curated OER
Review for the Final Exam - College Prep Algebra
In this algebra review worksheet, students solve 100 open-ended and multiple choice problems. Students factor, simplify, graph, and solve inequalities, expressions, and equations.
Benjamin Franklin High School
Saxon Math: Algebra 2 (Section 4)
This fourth of twelve units in a series continues the investigation of functions through equations and inequalities. However, the modular nature of the lessons in the section make this an excellent resource for any curriculum...
Mathematics Vision Project
Module 1: Sequences
Take steps into sequences. An 11-lesson unit builds upon pupils' previous understanding of writing expressions to develop the idea of sequences. The resource explores both arithmetic and geometric sequences using recursive and explicit...
Curated OER
Solving multi-step inequalities and solving systems by elimination
Students solve multi-step equations and apply the process of elimination. In this algebra lesson, students solve linear inequalities and equations using linear combination and evaluation. They graph their results on a number line...
EngageNY
Mid-Module Assessment Task: Grade 8 Module 4
Determine what the class knows about linear equations. The three-question mid-module assessment is segment 15 in a 33-part series. The assessment includes writing and solving one-variable linear equations and graphing proportional...
CK-12 Foundation
Quadratic Functions and Equations
The form of a quadratic function paints a picture of its graph. Young mathematicians explore this connection by locating key features on a graph and then writing the corresponding equations. The interactive tutorial highlights key...
CK-12 Foundation
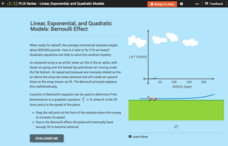
Linear, Exponential, and Quadratic Models: Bernoulli Effect
How can an object as heavy as an airplane fly? Turns out the answer is quadratic! Your classes explore the Bernoulli Effect through an interactive graph representation. As a plane increases in speed, the lift force also increases. Young...
CK-12 Foundation
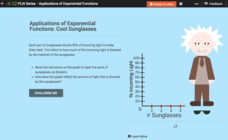
Exponential Decay: Cool Sunglasses
Who wouldn't want to wear four pairs of sunglasses? Each pair of sunglasses reduces the percent of incoming light by one-half. An interactive tutorial helps young mathematicians build a graph that models this scenario. They...
Curated OER
Algebra I: Linear Functions
Using rates from a rental car company, young mathematicians graph data, explore linear relationships, and discuss the role of slope and the y-intercept. This lesson allows for the discussion of independent and dependent variables, as...
Curated OER
Measurement and Algebraic Thinking
Comparatively speaking, does a bug travel farther than a human in 10 seconds? Get a bug and measure how far it travels in 10 seconds. Have a human team member run for 10 seconds and calculate the distance ran. Answer the question,"Who...
Ms. Amber Nakamura's Mathematics Website
Algebra Project
What would your dream house look like? A cottage? A medieval castle? High schoolers enrolled in Algebra design the perfect house while using slopes to write equations for various aspects of the project.
Curated OER
Discovering Different Types of Functions
Graph polynomials and identify the end behavior of each polynomial function. The class differentiates between linear, quadratic, and other polynomial equations.
Curated OER
Algebra 1
Students study the functional relationships of a variety of problems. For this functional relationship lesson, students determine the dependent and independent quantities of a given set of data. Students record the data and...
Curated OER
Graph Linear Inequalities
Int his algebra worksheet, 11th graders solve linear inequalities using algebra and graph their solution on a graph. They analyze graphs and write an equation for the inequality. There are 4 questions with an answer key.

