Curated OER
Hit Me If You Can!
Students graph linear equations using slopes and intercepts. In this algebra lesson, students identify the slope as being positive,negative or undefined. They differentiate between different quadrants on a coordinate plane.
Curated OER
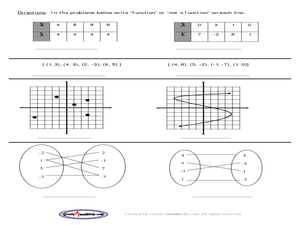
Functions Mixed Review: Pracctice A
Ninth graders review their knowledge of functions. In this Algebra I lesson, 9th graders determine if equations are linear or nonlinear, determine the slope and y-intercept of equations, and determine if a relation is a function in...
Curated OER
Finding our way
Tenth graders investigate the use of a GPS. In this math lesson, the students will use a GPS type system to determine positioning in two dimensions. They will complete questions out of a student workbook.
EngageNY
Factoring Extended to the Complex Realm
A solution will work one way or another: find solutions, or use solutions to find the function. Learners use polynomial identities to factor polynomials with complex solutions. They then use solutions and the Zero Product Property to...
Inside Mathematics
Party
Thirty at the party won't cost any more than twenty-five. The assessment task provides a scenario for the cost of a party where the initial fee covers a given number of guests. The class determines the cost for specific numbers of guests...
EngageNY
Translating Graphs of Functions
If you know one, you know them all! Parent functions all handle translations the same. This instructional activity examines the quadratic, absolute value, and square root functions. Pupils discover the similarities in the behavior of the...
EngageNY
Modeling with Polynomials—An Introduction (part 2)
Linear, quadratic, and now cubic functions can model real-life patterns. High schoolers create cubic regression equations to model different scenarios. They then use the regression equations to make predictions.
Radford University
Movie Projector Cost
Small groups analyze the attendance at a movie theater and determine the amount of money made for per show. Team members calculate the number of shows it would take for a theater to make a profit after purchasing a new digital projector....
EngageNY
Modeling with Exponential Functions
These aren't models made of clay. Young mathematicians model given population data using exponential functions. They consider different models and choose the best one.
Mathematics Vision Project
Module 9: Modeling Data
How many different ways can you model data? Scholars learn several in the final module in a series of nine. Learners model data with dot plots, box plots, histograms, and scatter plots. They also analyze the data based on the data...
Mathematics Vision Project
Module 8: More Functions, More Features
A piece of this and a piece of that, add domain restrictions and create a piecewise function. Young scholars explore piecewise functions with and without context. Functions include both linear and quadratic parts. The module is the...
Curated OER
Miami Metrozoo & Mathematics
Twelfth graders use Algebra and Geometry to solve a real life problem at the Zoo.
Curated OER
Row-Echelon Matrices
In this algebra learning exercise, students rewrite linear equations using matrices and solve using row-echelon form. There are 30 problems ranging from one equation to system of equations.
Curated OER
Between The Extremes
Learners analyze graphs for specific properties. In this algebra lesson, students solve equations and graph using the TI calculator. They find the different changes that occur in each graph,including maximum and minimum.
Curated OER
Spreadsheet Function Machine
Learners create a spreadsheet to analyze functions. For this algebra lesson, students use spreadsheets to find the intersection of systems of equations. They identify the dependent and independent function as it relates to a line.
Curated OER
Using a Multi- Sensory Approach
Learners identify the slope of a line given two points on the line. In this algebra instructional activity, students solve linear equations by finding and comparing slopes of lines. They differentiate between the steepness of the slope...
Curated OER
Matrix Operations
Students solve problems using matrices. In this algebra lesson, students add, subtract and multiply matrices. They use the graphing calculator to simplify and graph linear equations.
Curated OER
Graphing Inequalities
For this inequality worksheet, students solve inequalities on a coordinate plane by graphing. The linear equations contain two variables. This one-page worksheet contains ten problems.
Curated OER
Geometry: Parallel and Perpendicular Lines
This basic handout would be good for skills practice or a review of parallel and perpendicular lines. Review the definitions, then practice writing equations of lines that pass through a specific point and are either parallel or...
Institute of Electrical and Electronics Engineers
Rotational Equilibrium
Physics stars design mobiles that demonstrate rotational equilibrium. They take measurements and solve related equations for force by graphing, substitution, or determinants. This is a well-developed lesson plan, complete with student...
Sri Atmananda Memorial School
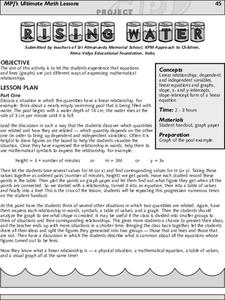
Rising Water
An engaging, and not to mention attractive, lesson plan has prealgebra and beginning algebra scholars examining linear relationships. They consider the rising water level as a swimming pool is being filled. They do so by charting and...
Texas Instruments
Let's Play Ball with Families of Graphs
Learners explore quadratic equations in this Algebra II lesson. They investigate families of quadratic functions by graphing the parent function and family members on the same graph. Additionally, they write the equation of the parabola...
02 x 02 Worksheets
Inverse Variation
Discover an inverse variation pattern. A simple lesson plan design allows learners to explore a nonlinear pattern. Scholars analyze a distance, speed, and time relationship through tables and graphs. Eventually, they write an equation to...
Alabama Learning Exchange
Solving Formulas for the Given Variable
Recycle, reuse, and rearrange! Young scholars learn to rearrange formulas to highlight a variable of interest. They then use their new formulas to make calculations.
