West Contra Costa Unified School District
Graphing Linear Inequalities Sort
Learners first determine the slope-intercept and standard forms of inequalities given graphs, and then determine key features of the graphs.
Illustrative Mathematics
Telling a Story With Graphs
Turn your algebra learners into meteorologists. Students are given three graphs that contain information about the weather in Santa Rosa, California during the month of February, 2012. Graph one shows temperatures, graph two displays the...
Illustrative Mathematics
Fishing Adventures 1
Often inequalities exist in many real-world contexts but young math learners struggle with understanding how to represent that relationship in a simple equation using an inequality. This activity focuses on the basic concepts by using...
Annenberg Foundation
Skeeters Are Overrunning the World
Skeeters are used to model linear and exponential population growth in a wonderfully organized lesson plan including teachers' and students' notes, an assignment, graphs, tables, and equations. Filled with constant deep-reaching...
Curated OER
What Functions do Two Graph Points Determine?
Your algebra learners write linear, exponential, and quadratic equations containing the same two graph points in this collaborative task.
Illustrative Mathematics
Fishing Adventures 2
This resource is part of a series which expects participants to be familiar with graphing inequalities on a number line. It is a word problem that asks your class to graph a discrete solution set and interpret it in the context of an...
Ms. Amber Nakamura's Mathematics Website
Algebra Project
What would your dream house look like? A cottage? A medieval castle? High schoolers enrolled in Algebra design the perfect house while using slopes to write equations for various aspects of the project.
Curated OER
How Much Folate?
This task includes scaffolding to support the introduction of the writing and graphing of linear inequalities. Then your geometry learners discover that writing down all possible combinations is not feasible so they are led to use...
Curated OER
Solution Sets
Here is a task that gives the graph of the solutions of a system of linear inequalities and asks learners to analyze and write the algebraic form of the systems. By turning the problem around, learners make the connections between...
West Contra Costa Unified School District
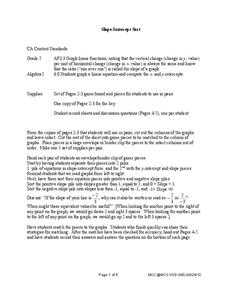
Slope-Intercept Sort
What's so special about slope? Pupils first match cards with slope and y-intercept to graphs of linear equations. They continue the lesson by matching equations in slope-intercept form to the same graphs.
Curated OER
Fishing Adventures 3
Your young boaters will enjoy writing and solving inequalities, and representing the solution graphically in this task set in the context of renting a boat.
5280 Math
More or Less the Same
Tell the story of the math. Given a graph of a linear system, learners write a story that models the graph before crafting the corresponding functions. Graphs intersect at an estimated point, allowing for different variations in the...
5280 Math
Capture the Points
Play a game of capture the points. Young scholars receive a number line with specific points graphed and must write an inequality that captures all the points. The second task of the algebra project is to write an inequality with...
Curated OER
Narrow Corridor
Buying a new sofa? Learn how to use the Pythagorean Theorem, as well as algebra and graphing techniques, to determine whether the sofa will fit around a corner (which I'm sure you'll agree is a very important consideration!).
5280 Math
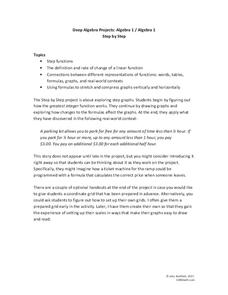
Step by Step
One step at a time! A seemingly linear relationship becomes an entirely new type of function. Young scholars build their understanding of step functions by completing a three-stage activity that incorporates multiple representations of...
Illustrative Mathematics
Peaches and Plums
According to the resource graph, which costs more: peaches or plums? Algebra learners compare two proportional relationships and then throw in a banana. Leaving out the scale helps students become intuitive about graphing.
Curated OER
Newton's Law of Cooling
Your Algebra learners analyze and solve an exponential equation in this popular, real-life model of the cooling of a liquid.
Curated OER
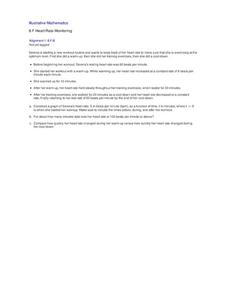
Heart Rate Monitoring
Algebra learners like this resource because it is easy to understand and it relates to their lives. Whether you are starting a new workout routine, or just climbing the stairs, your heart rate increases and decreases throughout the day....
Curated OER
Your Father
Your learners will explore the idea that not all functions have real numbers as domain and range values as seen in this real-life context. Secondly, the characteristics required for a function to have an inverse are explored including...
Texas Instruments
Texas Instruments: Glencoe Pre Algebra: Graphing Inequalities
Students will investigate the graphs of inequalities.
Texas Instruments
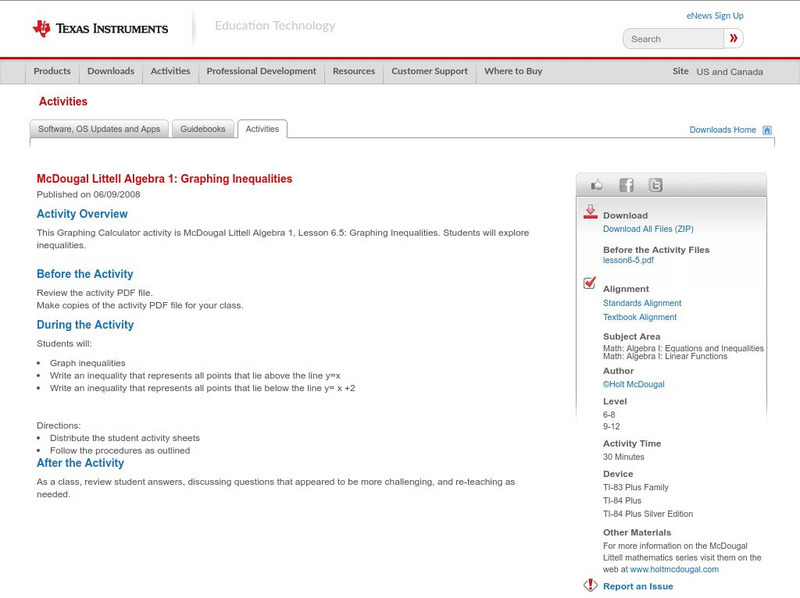
Texas Instruments: Mc Dougal Littell Algebra 1: Graphing Inequalities
Students will explore inequalities.
Oswego City School District
Regents Exam Prep Center: Linear Inequalities
Listed steps to graph an inequality along with a example that is graphed on a coordinate plane. Easy to read and understand!
Richland Community College
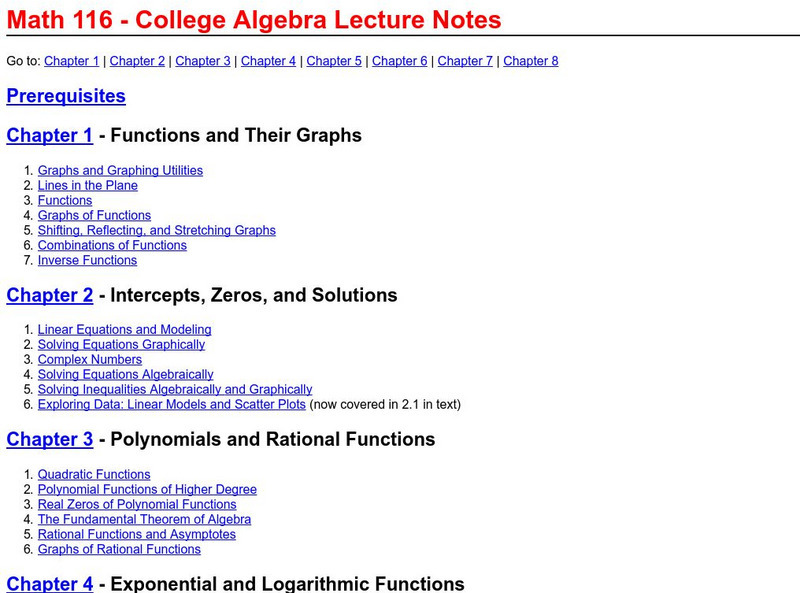
Richland Community College: Algebra Lecture Notes
This site from Richland Community College provides lecture notes to a class on Algebra. It covers a wide array of topics including functions, quadratic equations, inequalities, and much more.
Math Medics
S.o.s. Math: Algebra
This lesson provides basic instruction on the major concepts in algebra. Content includes a focus on fractions, units of conversion, complex numbers, quadratic equations, factorization and roots of polynomials, solving equations, systems...


