Curated OER
What's Your Favorite Fruit?
A sweet activity to challenge your first graders! The picture graph displays a class's favorite fruits. Young learners solve various problems with the data, including counting the amounts of each kind of fruit, and interpreting which...
Mascil Project
Parachute Food Drop
Drop a perfect project into your lesson plans. Groups use different building materials to create models of parachutes for food drops. After testing out their prototypes, they make improvements to their designs.
Novelinks
The Adventures of Tom Sawyer: Concept Analysis
Ready yourself for The Adventures of Tom Sawyer with this analysis of the novel. Included here is a summary of the plot, a list of themes, notes on vocabulary and other issues, a brief analysis of plot elements, and project ideas...
Baylor College
Energy for Life (Energy from Food)
Energy comes in many forms, but how do living things get the energy they need to survive and thrive? In a simple, controlled experiment with yeast, water, and sugar, groups make observations about how yeast reacts with water alone, then...
Curated OER
Calcium Counts
Pupils evaluate the food pyramid. In this dairy nutrition instructional activity, students identify the position of the milk group on the food pyramid, then determine their daily calcium requirement and how they can meet that requirement.
Curated OER
Whale Migration - The Long Journey
Marine biology learners examine right whale sighting data from the WhaleNet website. They plot the data on a map and write down the number of adults and calves spotted. Questions accompany the data analysis activity, making this a...
Curated OER
Healthy Choices
Fifth graders discover how to make healthy choices in nutrition. In this nutrition lesson, 5th graders research the daily nutrition requirements recommended by the U.S. Department of Agriculture. Students keep a food diary for three days...
Curated OER
What Did It Cost 100 Years Ago?
Students compare prices of good across the century in order to introduce the topic of inflation. They undertand the concepts of inflation and Consumer Price Index (CPI), use online calculators to figure the approximate cost of goods...
Curated OER
What’s the Shape of Your Diet?
Students analyze their diets. In this healthy diet activity, students keep food journals and examine their diets next to the recommended daily allowances of MyPyramid for Kids.
Curated OER
Falling Food Lesson
Students examine personal health by defining the five food groups. In this food pyramid lesson, students discuss the importance of each food group and write them on the board. Students utilize the Internet to participate in a food...
Curated OER
Food Labels Lesson
Students analyze nutrition by completing an interactive activity with classmates. In this food choice lesson, students discuss the importance foods have on our daily lives by keeping us healthy and giving us energy. Students examine food...
Curated OER
Fat Fast Foods
Students explore the fast food industry. In this fast food lesson, students research fast food restaurants and the food served. Students create a tri-fold handout to explain the history of fast food and types of food served. Students...
Curated OER
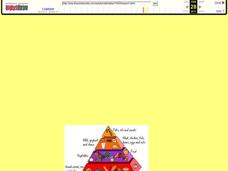
Food Pyramid
Young scholars identify good nutrition. In this food pyramid lesson, students learn the basics of good nutrition, identify the six basic food groups, state the effects of the food on the human body, and learn nutritional information...
Curated OER
Tables & Data
For this problem solving worksheet, 4th graders study the data found on a table involving the number of cans collected during a fund-raiser. Students utilize the concepts of addition and subtraction to solve 8 sentence word problems.
Curated OER
Fast Food Survey Using Bar Graphs
Second graders create a bar graph to pictorically represent the data collected from a survey of students. They use Excel to electronically create the graphs and data tallies. They then interpret their data using sentences to explain.
Alabama Learning Exchange
Light, Dry and Nutritious - A Look at Dehydrated Food
Fifth graders study dehydration and dehydration of foods. They measure the amount of water lost from fruits as they are dehydrated. They use desktop publishing software to design an advertisement for dehydrated fruit after researching...
Curated OER
Green Food Graph
Students explore graph making by investigating St. Patrick's day food. In this holiday food lesson, students discuss their favorite green foods in honor of St. Patrick's day. Students create a graph based on the data of which green foods...
Curated OER
Food for Thought
Fifth graders explore the brain and what is needs. In this biology lesson plan, 5th graders will work on a series of activities that will allow them to learn about the brain, its parts, and the best foods to eat for their brain.
Curated OER
Ethics Activity: Issue Analysis
Learners analyze environmental health issues with respect to the players, their positions, and associated values, after being introduced to the concepts of events, problems, and issues. They apply the skills of issue analysis to...
Howard Hughes Medical Institute
Building Ecological Pyramids
Looking for a fresh take on traditional food/energy pyramids? Conduct an innovative activity where pupils build their own! The lesson uses research data from Gorongosa National Park in Mozambique for a real-life safari touch. Scholars...
Towson University
The Crucial Concentration
Which sports drink provides the best pick-me-up after the big game or grueling workout? It may not be the one you'd think! Food science is the focus in a surprising lab activity. Pupils use colorimetry to determine the amount of protein,...
National Endowment for the Humanities
“Read All About It”: Primary Source Reading in “Chronicling America”
Can investigative journalism become too sensationalistic and accusatory, or is it vital for the survival of a democracy? Middle schoolers analyze primary source documents from early 20th-century newspapers as well as Theodore...
Virginia Department of Education
May I Have Fries with That?
Not all pie graphs are about pies. The class conducts a survey on favorite fast food categories in a lesson on data representation. Pupils use the results to create a circle graph.
K12 Reader
Displaying Data
It's important to learn how to display data to make the information easier for people to understand. A reading activity prompts kids to use context clues to answer five comprehension questions after reading several paragraphs about...
Other popular searches
- Cost/benefit Analysis Food
- Food Label Analysis
- Food Analysis
- Food Drive Data
- Cost Analysis Food Service
- Dog Food Analysis


