Curated OER
The Effect Of Transportation Systems On The Early Economic Development Of Indiana's Counties
Twelfth graders analyze the impact of transportation systems on the early economic development of Indiana's counties. They examine U.S. Census records, analyze data, and prepare a graphical depiction of the rates at which sample...
Curated OER
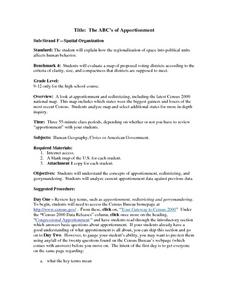
The ABC's of Apportionment
Students are introduced to the terms of apportionment and redistricting. Using a Census map, they identify the states that had the highest and lowest numbers of change during the past ten years. They examine a map of voting districts and...
Curated OER
Mapping Population Changes In The United States
Students create a choropleth map to illustrate the population growth rate of the United States. They explore how to construct a choropleth map, and discuss the impact of population changes for the future.
Curated OER
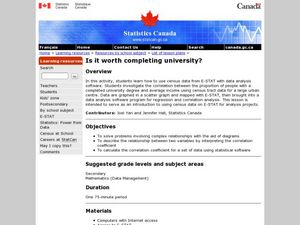
Completing University
Students analyze the pros and cons of completing a 4 year school. In this statistics lesson, students complete surveys and use E-STAT to graph their data. They learn to plot and build diagrams.
Curated OER
Age and Sex
Students create and analyze a population pyramid based on age and sex data from the 2001 Census. They explain and interpret the population pyramid other students have produced.
Curated OER
Pop Clock
Young scholars explore the Census Bureau's Homepage on the Internet to gather data regarding trends in population, poverty guidelines, and social characteristics between caucasians and minorities. The data is used to investigate evidence...
Curated OER
African American Population Shifts
Students investigate population trends. In this African American history instructional activity, students access U.S. Census records from 1900 to the present online. Students analyze the migration of African Americans from one area of...
Curated OER
I'm Late, I'm Late, for a Radioactive Date!
Through the use of an interactive Web site, students explore C-14 and C-14 dating. Then students analyze an article written about the C-14 dating of the Shroud of Turin and draw conclusions.
Curated OER
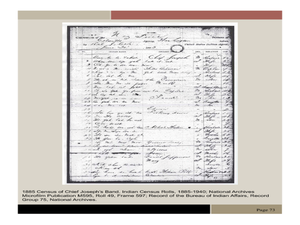
Chief Joseph and the Nez Perce
Eleventh graders explore the life of Chief Joseph and Nez Perce. In this US History lesson, 11th graders analyze paintings and photos detailing the flight of Nez Perce. Students create a narrative newspaper article based on...
Curated OER
Germans and Irish in Augusta and Franklin Counties
Students examine 19th century newspapers, a last and testament, and census manuscripts to analyze the Irish and German immigrant communities in the 1850s and 1860s. They write a letter from the perspective of an Irish or German immigrant.
Curated OER
A Look at Race in America Using Statistics
Eleventh graders explore the issue of racism in America. In this American History lesson, 11th graders analyze charts and graphs on blacks and whites in America.
Curated OER
Carpooling and the Environment
Students investigate carpooling and determine to what extent it occurs in their community for a carpool challenge. In groups, students create a survey then collect, calculate and record data to determine how much pollution could be...
Curated OER
Progress Amidst Prejudice: Portraits of African Americans in Missouri, 1880-1920
Young scholars explore and analyze a database of historical portraits of an African American family of the late 1800's. They trace the migration of one of the African Americans as he/she migrates toward urban areas.
Curated OER
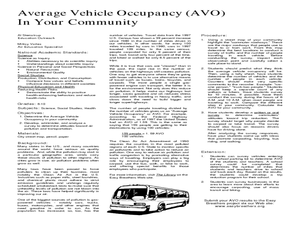
Average Vehicle Occupancy In Your Community
Students determine the average vehicle occupancy in their community. In this transportation lesson plan students develop and analyze a survey to determine attitudes towards air pollution and transportation.
Curated OER
It's Your Life
Students make a multiple line graph showing income levels for each education level for the past 8 years and the number of people for each ethnic group and gender is compared within each education level.
Curated OER
Push/Pull Factors and Welsh Emigration
Students view and discuss short sections of movies that relate to immigration. Working in groups, students create a map that shows directions of internal migration in their assigned geographical area. Students review ads/booklets created...
Curated OER
Linguistic Diversity Secondary
Don't be scared off by the title! Read this information packet with your class, or send them off on their own. After each section, you'll find a series of comprehension questions. Great preparation for state testing!
Curated OER
Population Pyramids
Students explain the significance of population trends on world regions. They define relevant population vocabulary and examine age-gender patterns at various scales.
Curated OER
Jazz in America
Eleventh graders explore Jazz in America. They examine greats in Jazz, such as Duke Ellington. They are also to discuss the cultural implications of the music itself.
Curated OER
Building an Empire Mapping China
Learners create travel brochures of China's nine regions and make a bulletin board display with them.
Curated OER
Critter Characteristics
Young scholars explore the adaptations of deep sea life forms. In this science lesson, students watch a video to observe characteristics which allow for the sea creature to thrive in it's environment. Young scholars determine the...
Curated OER
An Introduction to Elementary Statistics
Students explain and appreciate the use of statistics in everyday life. They define basic terms used in statistics and compute simple measures of central tendency.
Curated OER
An Act of Courage, The Arrest Records of Rosa Parks
Students research accounts on Rosa Parks and look for differences between the modern form and an older report on Parks. They discuss why information about race and nationality are collected on these and other forms.
Science Education Resource Center at Carleton College
Serc: The Digital Divide: A Data Analysis Activity Using Subtotals
A lesson plan that includes a PowerPoint learning module for students. The purpose of the lesson plan is to teach how to use Excel to analyze a large amount of data, in this case from the US Census. The example being used is the...

