National Security Agency
Line Graphs: Gone Graphing
Practice graphing and interpreting data on line graphs with 36 pages of math activities. With rationale, worksheets, and assessment suggestions, the resource is a great addition to any graphing unit.
National Security Agency
Going Green with Graphs
In this unit designed for second graders, youngsters are introduced to conducting surveys and creating tally charts based on the data they gather. Students then construct bar graphs, and observe the relationships between the two...
Beyond Benign
Municipal Waste Generation
Statistically, waste may become a problem in the future if people do not take action. Using their knowledge of statistics and data representation, pupils take a look at the idea of waste generation. The four-part unit has class members...
North Carolina State University
Exploring Genetics Across the Middle School Science and Math Curricula
Where is a geneticist's favorite place to swim? A gene pool. Young geneticists complete hands-on activities, experiments, and real-world problem solving throughout the unit. With extra focus on dominant and recessive genes, Punnett...
Columbus City Schools
Totally Tides
Surf's up, big kahunas! How do surfers know when the big waves will appear? They use science! Over the course of five days, dive in to the inner workings of tidal waves and learn to predict sea levels with the moon as your guide.
Radford University
Sleep and Teen Obesity: Is there a Correlation?
Does the number of calories you eat affect the total time you sleep? Young mathematicians tackle this question by collecting their own data and making comparisons between others in the class through building scatter plots and regression...
Curated OER
You Scratch my Back, I'll Scratch Yours
Students explore the concept of interdependence. In this integrated interdependence lesson, students interpret graphs and charts that require them to analyze the relationship between Mexico and the United States. Students also...
Curated OER
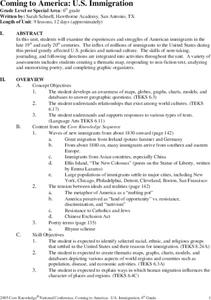
Coming to America: U.S. Immigration
Students study immigration in the late 19th and early 20th century. In this immigration lesson plan, students participate in activities including creating maps, responding to non fiction text, memorizing and analyzing poetry, and...
Texas Education Agency
Texas Gateway: Analyze Graphical Sources: Practice 2 (English I Reading)
This lesson focuses on practice exercises to understand and interpret the data in a graphic representations including pie charts, bar graphs, and line graphs.
Texas Education Agency
Texas Gateway: Analyze Graphical Sources: Practice 2 (English Ii Reading)
[Accessible by TX Educators. Free Registration/Login Required] Analyze the factual, quantitative, and technical data in graphs and charts.
Texas Education Agency
Texas Gateway: Analyzing Two Dimensional Motion
Given descriptions, illustrations, graphs, charts, or equations, students will analyze motion in two dimensions, including projectile and circular motion.
Texas Education Agency
Texas Gateway: Analyze Graphical Sources: Practice 2 (English I Reading)
Analyze the factual, quantitative, and technical data in graphs and charts.
Texas Education Agency
Texas Gateway: Data Analysis
Given laboratory investigation data in the form of tables, charts, and graphs, students will analyze and predict trends from the data.
Sophia Learning
Sophia: Using Graphs to Analyze Data
This lesson will demonstrate how to analyze and interpret data given in the form of a graph.
Khan Academy
Khan Academy: Reading Dot Plots & Frequency Tables
Practice reading basic dot plots and frequency tables. Students receive immediate feedback and have the opportunity to try questions repeatedly, watch a video or receive hints.
Texas Education Agency
Texas Gateway: Motion in One Dimension
Given descriptions, illustrations, graphs, charts, or equations, students will analyze motion in one dimension.


