Howard Hughes Medical Institute
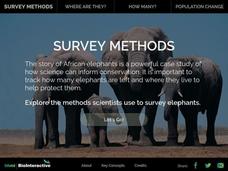
Survey Methods
How many African elephants are on earth? How do scientists answer a question like that? An interactive resource explains a variety of survey methods and their advantages and disadvantages. It connects the need for a survey to...
Curated OER
Determination of Phylogenetic Relationships Using Restriction Analysis
Students applied various mathematical analyses to interpret their data. By using the resulting DNA fragment patterns from several enzymes students established a possible evolutionary relationship among the mice.
Curated OER
Allele and Phenotype Frequencies in Rock Pocket Mouse Populations
In the deserts of Arizona and New Mexico, some tiny creatures show just how quickly natural selection can turn a mutation into an advantageous adaptation. Watch a video about rock pocket mice, who show that one small change can make all...
Kenan Fellows
Applying Linear Regression to Marathon Data
It's not a sprint, it's a marathon! Statistic concepts take time to develop and understand. A guided activity provides an opportunity for individuals to practice their linear regression techniques in spreadsheet software. The activity...
Kenan Fellows
Using Motion Sensors to Explore Graph Sketching
Get moving to a better understanding of graphs of derivatives. Using motion sensors, scholars vary their velocities to create graphs of the first derivative of a function. The activity challenges groups to first create a script of the...
Kenan Fellows
Man vs. Beast: Approximating Derivatives using Human and Animal Movement
What does dropping a ball look like as a graph? An engaging activity asks learners to record a video of dropping a ball and uploading the video to software for analysis. They compare the position of the ball to time and calculate the...
Curated OER
Trouble in the Troposphere
Students Use data sets from MY NASA DATA to produce graphs comparing monthly and yearly ozone averages of several U.S. cities. They analyze and evaluate the data and predict trends based on the data. In addition, they discuss and...
Curated OER
An Investigative Task
Students read an article about statistics. In this statistics instructional activity, students are given a detailed overview about statistics and what it entails. This instructional activity is more informational and hands on.
Other popular searches
- Ap Biology Lesson Plans
- Ap Biology Vocabulary
- Ap Biology Unit 1
- Ap Biology Cells
- Ap Biology Evolution
- Ap Biology Respiration
- Ap Biology Bacteria
- Ap Biology Photosynthesis
- Ap Biology Animals
- Ap Biology Heart
- Diabetes Ap Biology
- Ap Biology Chemistry


