PBL Pathways
Students and Teachers 2
Examine trends in student-to-teacher ratios over time. Building from the first task in the two-part series, classes now explore the pattern of student-to-teacher ratios using a non-linear function. After trying to connect the pattern to...
EngageNY
Describing the Center of a Distribution Using the Median
Find the point that splits the data. The lesson presents to scholars the definition of the median through a teacher-led discussion. The pupils use data lists and dot plots to determine the median in sets with even and odd number of data...
Curated OER
Applying Trigonometric Functions To Real Life
Students examine where trigonometry exists outside the classroom. In this trigonometry lesson, students create trigonometric functions to match the data provided and to solve word problems relating to the real world.
Curated OER
Water Regulation
Students use their basic knowledge of physiology to analyze graphical data of paramecia under diverse conditions. From the data analysis, Students develop explanations of the animal's response to the concentration of different solutions...
Curated OER
Squares in the Light
Students collect and analyze data using a graph. In this algebra lesson, students explain their findings orally and with a graph. They use their knowledge to solve real life scenarios.
Curated OER
Time That Period
Physical science starters play with a pendulum in order to experience periodicity. Detailed procedures and a worksheet are included for day one. For day two, learners will use a graphing calculator to help them plot orbit data from a...
Curated OER
Matchstick Math: Using Manipulatives to Model Linear, Quadratic, and Exponential Functions
Playing with matches (unlit, of course) becomes an engaging learning experience in this fun instructional unit. Teach pupils how to apply properties of exponential functions to solve problems. They differentiate between quadratic and...
Curated OER
Bouncing Ball
High schoolers collect height versus time data of a bouncing ball using the CBR 2™ data collection device. Using a quadratic equation they graph scatter plots, graph and interpret a quadratic function, apply the vertex form of a...
Curated OER
Exploration of "Pillbugs"
Fifth graders define vocabulary terms, identify the characteristics of a pillbug, and create a dichotomous key. Then they examine the pillbugs and make observations and record these observations. Finally, 5th graders observe specific...
Curated OER
Exponential Growth versus Linear Growth II
Your algebra learners discover that exponential functions, with a base larger than one, outgrow linear functions when the inputs increase sufficiently. Their analysis includes using a graphing calculator to produce tables.
Curated OER
Awesome Animals
Students collect data from classmates about their favorite animal. They use the ClarisWorks graphing program to enter data, graph results, and interpret data.
Curated OER
Rainbows, Bridges & Weather, Oh My!
Explore how real-world applications can be parabolic in nature and how to find quadratic functions that best fit data. A number of different examples of modeling parabolas are explored including a student scavenger hunt, the exploration...
Curated OER
Spaghetti Graphs
Students work in pairs to test the strength of spaghetti strands. They collect and graph data to determine a line of best fit. Students create a linear equation to interpret their data. Based on the data collected, students predict...
Curated OER
Table Interpretation
Pupils solve problems using graphs to list and interpret data. Each student construct his or her own graph using art paper and markers. They be given a set of information to apply to their graphs and interpret their findings.
Curated OER
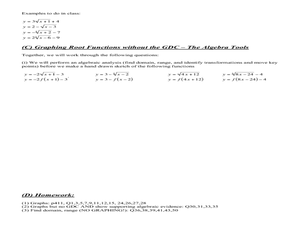
Graphing Radical Functions-A Graphic Introduction
In this Algebra II worksheet, 11th graders graph root functions and analyze the domain, range, intercepts, maximum and minimum values, and end behavior. students use that information to transform the graphs of root...
Curated OER
Introduction to Inverse Functions
Students investigate patterns of inverse functions. In this algebra lesson, students represent functions with the calculator and on paper. They analyze their data and draw conclusions.
Curated OER
Paper Pool
Learners analyze the measurements of rectangles. In this analysis lesson, students will investigate patterns by looking at ratios. Learners will also hypothesize the probability of a ball going into a certain pocket when playing pool....
Curated OER
Discovering the Area and Perimeter of Triangles
Eighth graders identify how to find the area and perimeter of rectangles and triangles. They discuss their understanding of area and perimeter and how the two concepts are applied in the real world. Finally, 8th graders determine the...
Curated OER
Know Yourself
Eleventh graders explore the events of the Holocaust. In this cross curriculum lesson plan, 11th graders examine the differences between prejudice and discrimination. Students read various forms of literature and write...
Curated OER
What's Shaking? Three-Lesson Unit
Your young architects use the Internet to research tall structures or sky scrapers to help in the design of their scale drawings. This is lesson one of three in which learners design, build, and test model skyscrapers for seismic safety....
Curated OER
Promote Precalculus
Use projects, real-world activities, and games to bring precalculus to life for students.
Visa
Money Responsibility
Introduce young learners to the important life skill of responsibly managing money and recording how much they spend and save.
Curated OER
Introduce Double-Digit Addition
Students generate a list of numbers then classify them into groups of single digit and double-digit numbers. After listening to a children's book about double-digit addition, they work with tens and ones blocks to solve double-digit...
Curated OER
Populations Lab - Exponential Graphing
Ninth graders investigate the application of populations that exists in one's everyday environment, in order to develop an understanding of how mathematics is a key component in the understanding of population dynamics.


