National Security Agency
Line Plots: Frogs in Flight
Have a hopping good time teaching your class how to collect and graph data with this fun activity-based lesson series. Using the provided data taken from a frog jumping contest, children first work together creating a line plot of the...
Shodor Education Foundation
Algebra Quiz
Reviewing the process of solving equations is as easy as one click of a button. Scholars solve linear and quadratic equations by using a helpful interactive. The computer app automatically scores responses, providing immediate feedback...
Edmond Public Schools
8th Grade Science Resource Book: Unit 2 - Physics
Get things moving with this extensive collection of physical science resources. Covering the fundamentals of measurement, graphing, lab safety, and experimental design as well as the specific scientific concepts of velocity,...
Shodor Education Foundation
Simple Maze Game
Avoid the mines and win the game! Young scholars direct a robot through a minefield by plotting points. Their goal is to reach the target in as few moves as possible.
Shodor Education Foundation
Squaring the Triangle
Teach budding mathematicians how to square a triangle with an interactive that shows a graphical proof of the Pythagorean Theorem. Pupils alter the lengths of the legs using sliders. Using the inputted lengths, the applet displays the...
Shodor Education Foundation
Racing Game with One Die
Pupils roll a die to figure out which car advances on a race track. They determine the rules for each car moving forward and, given the statistics of the winner, compare if it matches their predictions.
Shodor Education Foundation
Marbles
Grab some marbles from a bag. The applet simulates drawing marbles from a bag. Pupils determine the number of four colors of marbles in a bag and how many marbles to draw. Using information on whether order matters in the draw and if...
Shodor Education Foundation
Buffon's Needle
Find the needle on a lined paper. Pupils run a simulation of dropping a needle on a lined paper. The probability of the needle crossing at least one line is pi/2. After each trial, the interactive displays the approximation of pi based...
Shodor Education Foundation
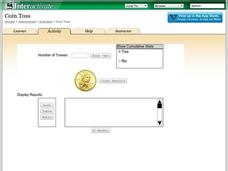
Coin Toss
Are your young mathematicians having a hard time making heads or tails of probabilities? It's no toss up—here is a resource that's sure to straighten them out! Learners run the interactive to toss a coin a different number of times....
Shodor Education Foundation
Skew Distribution
Slide the class into a skewed view. Learners alter the location of the median relative to the mean of a normal curve to create a skew distribution. They compare the curve to a histogram distribution with the same skewness.
New York City Department of Education
Dance and Text
Use texts and dances to teach inequalities and equations. A sixth-grade unit covers using variables in equations and inequalities to solve problems. Learners show what they know at the end of the unit using two performance tasks, one...
Curated OER
The Geometry of Indigenous Art
Students examine the concepts of symmetry, rotations, reflections, translation, dialations, and tessellations and apply them to indigenous art. They also do Internet research and create artwork (painting, pottery, computer graphic design).
Curated OER
Fractions in the Kitchen
Seventh graders use the World Wide Web for research, identify fractions found in everyday life by finding a recipe that uses fractions.
Intel
What Does This Graph Tell You?
Students choose natural phenomena to research. They design and conduct experiments or simulations. Students predict, gather, and analyze data. They graph the results using a spreadsheet software.
Curated OER
When Are We Ever Going to USE This MATH?
Fourth graders engage in discussion of various occupations and learn where math fits into the scheme of things. They are diagnostically assessed to determine proficiency in computer, writing, and problem-solving mathematical skills set...
Curated OER
Frequency Distributions and Measures of Central Tendency
Twelfth graders use the Internet to research information on NFL players and construct frequency distributions from the data. They calculate the mean, medium and analyze their data.
Curated OER
Making Good Investments
High schoolers compare different aspects of investing money from traditional savings accounts to money market accounts. They research investment accounts at local banks and compare them.
Curated OER
Real-World Linear Equations
Eighth graders practice technology skills through the use of a spreadsheet and a discovery lesson focusing upon linear equations. The technology allows for the visual changes to be displayed for different lines of equations.
Curated OER
Campaign 2000
Students research newspapers and the Internet to learn about the election. Students work in groups and choose a state that they want to compare to Florida. Students organize the data they have found into a graph labeling an "x" and "y"...
Curated OER
Touring the Regions of the United States
Fifth graders explore the regions of the United States. They use maps, research on the Internet and use measurements and estimations. Students create a presentation using spreadsheets and publishing software.
Curated OER
Time for All Ages
Fourth graders discover time keeping by analyzing technological advances in history. For this time lesson, 4th graders create and complete a KWL chart based on their research of a famous timekeeping invention, such as a sundial....
Curated OER
The Great Race: From Anchorage to Nome
Students study the history of the Iditarod sled dog race. They research facts related to biology, sled dogs, and geography in order to put that history in perspective.
Curated OER
Celebrate Black History
Students research African-American mathematicians. In this middle school mathematics instructional activity, students celebrate Black History by conducting Internet research on an African-American, mathematicians or scientist. Students...
Curated OER
Probability and Sports
Students explore the concept of probability in sports. In this probability in sports lesson, students research a sport that they enjoy. Students find probability information related to their sport. Students share their findings with the...


