Curated OER
Better Than Average
Students analyze how to calculate averages, and discuss the use of averages in baseball. They calculate averages and decimals to thousandths using the data on baseball cards.
Virginia Department of Education
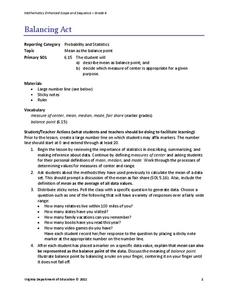
Balancing Act
How many different interpretations of the mean are there? Scholars place numbers on a number line and determine the mean. They interpret the mean as the average value and as the balance point.
Curated OER
Averaging
Sixth graders explore the concept of mean, median, mode, and range. In this mean, median, mode, and range lesson, 6th graders work in groups to find the mean, median, mode, and range of their heights, distance from home to school, time...
Willow Tree
Weighted Averages
Mixtures, weighted percentages, and varying speeds make problem solving difficult. The resource give learners a strategy for tackling these types of problems effectively.
University of Georgia
Bag O' Isotopes
Accommodate your chemistry class with an experiment that is both entertaining and educational. Through the activity, blossoming chemists perform calculations on various isotopes, as represented by beans and legumes, to obtain the average...
Virginia Department of Education
Distance and Midpoint Formulas
Small groups work through two guided activities to derive the distance and midpoint formulas for the coordinate plane. The activities begin with concrete examples and move to abstract.
Curated OER
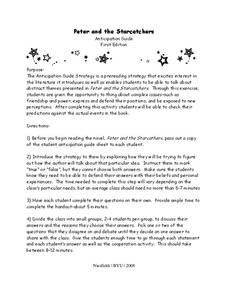
Peter and the Starcatchers: Anticipation Guide
Pique your pupils' interest before reading Peter and the Starcatchers with an anticipation guide. Given a list of 10 statements, learners choose true or false based on what they think the book is about. They then discuss in small groups...
Curated OER
Average Looking
Students use measurements of their classmates to find the average (means and modes) of their facial features. They use their findings to create a three-dimensional "class head." Examples and assessment materials are included.
Curated OER
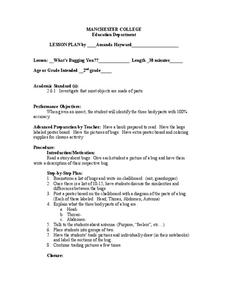
What's Bugging You?
Second graders investigate insects. In this parts of a whole, 2nd graders discuss what the three body parts of an insect are as well as the antenna. Students create their own insect labeling each body part and antenna.
Curated OER
Understanding Pi.
Students study the relationship between circumference and diameter to come up with Pi. "In this pi lesson, students measure, record and find the ratio "circumference/diameter" and their average which is an approximation of pi.
Curated OER
Digger and the Gang
Help online friends Digger and Sprat from the BBC series to solve math problems! In a series of activities, your class will use data sets to calculate measurements, averages, means, and probabilities. The class completes worksheets and...
Curated OER
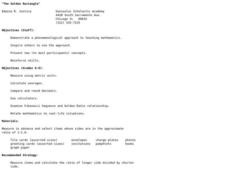
The Golden Rectangle
Middle schoolers explore the concept of the golden ratio. In this golden ratio lesson, students measure objects to determine if their measurements fit the golden ratio. Middle schoolers calculate the average measurements of the class.
Curated OER
Calculating Baseball Statistics
Students calculate baseball statistics. In this data analysis lesson plan, students use baseball statistics to calculate the batting average and slugging percentage. Students visit www.funbrain.com to play a math baseball game.
Curated OER
The Average Atom - Isotopes
Seventh graders, in groups, complete an Isotopes model and notice that atomic masses are decimal numbers. These masses are an average of all the isotopes of that element.
Curated OER
Speeding By The Numbers
Students determine speed by running or walking a given distance and dividing the distance by the time it took them to do so. They record their average speed and compare it with the speeds of other moving objects.
Curated OER
Negative & Positive Numbers
Students recognize positive and negative numbers and perform mathematical functions.
Willow Tree
Mean, Median, and Mode
Statistics are more than just numbers—they can give you important information about a set of data. Pupils learn how to find the mean, median, and mode of a data set. They also find the next score to reach a desired mean.
Curated OER
Dynamic Data Range, Mode, Median, and Mean
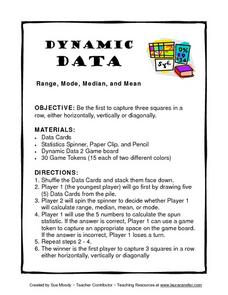
For this lesson, Dynamic Data Range, Mode, Median, and Mean, young scholars play a game while figuring range, mode, median, and mean. Students spin for their task, figure the mode, mean, median or range of a row of numbers and gain a...
Curated OER
Integration: Statistics
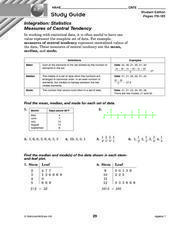
For this math worksheet, learners find the mean, median and mode for 6 number sets. Students then find the median and mode for data found in 2 stem-and-leaf plots.
Curated OER
Finding Averages
Students have problems in the lesson where they need to find the average of a set of numbers. As a class, they work a few problems and then independently complete a worksheet practicing their new skill.
Curated OER
Global Warming Statistics
Young scholars research and collect data regarding temperature changes for a specific location and find the mean, median, and mode for their data. For this climate change lesson, students choose a location to research and collect data...
Willow Tree
Midpoint and Distance Formulas
The shortest distance between two points is a straight line. Learners use the Pythagorean Theorem to develop a formula to find that distance. They then find the midpoint using an average formula.
EngageNY
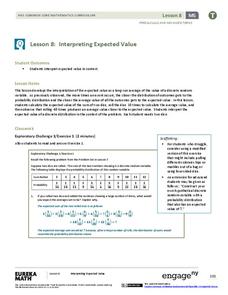
Interpreting Expected Value
Investigate expected value as a long-run average. The eighth installment of a 21-part module has scholars rolling pairs of dice to determine the average sum. They find aggregate data by working in groups and interpret expected value as...
Curated OER
Measures of Central Tendency: Pages 178-183
In this math worksheet, students find the mean, median and mode for 2 stem and leaf tables, 4 number sets. Students also find a set of numbers for given mean, median and mode.


