Willow Tree
Weighted Averages
Mixtures, weighted percentages, and varying speeds make problem solving difficult. The resource give learners a strategy for tackling these types of problems effectively.
West Contra Costa Unified School District
Using Bar Models to Solve Rate Problems
Pupils visualize distance-rate-time problems by using bar models. The lesson plan presents examples of four different types of rate problems and shows how they can be solved using bar models and equations. Each example is followed by a...
EngageNY
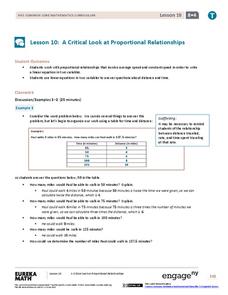
A Critical Look at Proportional Relationships
Use proportions to determine the travel distance in a given amount of time. The 10th installment in a series of 33 uses tables and descriptions to determine a person's constant speed. Using the constant speed, pupils write a linear...
Curated OER
Linear Motion: Speed, Velocity & Acceleration
Students explore the concept of linear motion. In this linear motion lesson, students calculate distance and time in order to calculate average speed and velocity in the provided problems.
Curated OER
Motion: Speed, Velocity, Acceleration and Networking
Students interpret a variety of motion graphs. In this physics lesson, students calculate the speed and acceleration of objects using numerical data from graphs. They apply what they have learned to solve real world problems.
Curated OER
Worksheet #5: Mixture Word Problems
In this mixture word problem worksheet, young scholars read story problems and determine what information is necessary to solve the mixture problem. They identify the correct solution, graph inequalities, and solve inequality equations....
West Contra Costa Unified School District
Talking About Distance, Rate and Time
Connect the tortoise and the hare fable to mathematics. Learners first identify key terms related to distance, rate, and time. They then solve distance/rate/time problems using different representations.
Curated OER
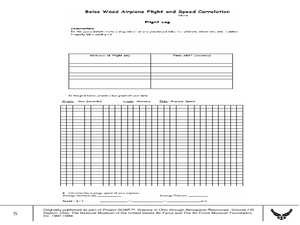
Balsa Wood Airplane Flight and Speed Correlation
Ninth graders calculate the average speed of their balsa wood airplane. In this physics lesson, 9th graders build their own airplane and make necessary modifications to to make it fly straight. They interpret distance and time graph...
Curated OER
Domino Dash
In this speed worksheet, students use dominoes to measure the average speed of rows falling over. Students make a line graph to show the relationship between the length of the domino row and the time. Students answer 8 questions about...
Curated OER
Position vs. Time and Velocity vs. Time Graphs
In this constant velocity worksheet, students use data of position vs. time of a roller-skater to determine speed, acceleration, or deceleration at different points along the path. Students rank graphs according to average velocity and...
Curated OER
Calculating Speed
Fourth graders complete an experiment on calculating speed. In this speed calculation lesson students complete an activity in which they have dominoes fall as slow as possible.
Curated OER
American Journeys: Right Place, Right Time
Sixth graders measure distances on a map using string and a ruler. They complete mathematical word problems about measurement.
Curated OER
"Go-Car" Lab
Students construct a car based on directions given. In this physics lesson, students calculate average speed using distance and time information. They collect data and create a graph of distance vs. time.
Curated OER
Speed, Distance and Time
Students are introduced to the concept of speed and the difference between average and instantaneous speed. They work as a class to solve a variety of word problems to calculate average speeds without a calculator. The students are then...
Curated OER
"So Tell Me About Your Trip..."
Students research destinations and the factors involved in taking a trip and explore how averages play a part in making decisions. They explore how to find the average speed and the distance to a particular destination, they estimate...
Curated OER
Newton's Three Laws of Motion Lesson Plan
Students explore Newton's three laws of motion using a variety of activities. In this physics lesson plan, students calculate the average speed of a vehicle they constructed using distance and time information. They identify and draw the...
Curated OER
Velocity
Students determine the average speed of a toy car as it travels six different distances set up by Students. Three trials are done for each distance. The only requirements is that the longest distance must be at least three times longer...
Curated OER
Word Problems: Distance = Rate x Time
In this word problem worksheet, students read word problems, and set the information into the distance formula. They solve the formula to determine the distance, rate and time. This two-page worksheet contains six problems, with answers.
Curated OER
Up, Up, and Away
Young scholars study the concepts of speed and velocity and complete practice problems. In small groups, students fly airplanes and record time and distance traveled for each flight. They calculate the speed and velocity of their plane...
K20 LEARN
Driving Rationally: Introduction To Rational Functions And Asymptotes
Calculating average speeds is not as simple as finding an average. The instructional activity introduces class members to rational functions by presenting a problem about finding an average speed for the rest of a trip. Pupils develop an...
Curated OER
Domino Dash
Eighth graders examine the relationship between speed, time and distance. In this motion lesson students complete a lab activity that allows them to calculate average speed.
Curated OER
Flying With Mathematics!
Third graders fly miniature airplanes to discover characteristics related to velocity and average speed. After measuring the time and distance of their flights, 3rd graders calculate the average velocity of their planes.
Curated OER
Digger and the Gang
Help online friends Digger and Sprat from the BBC series to solve math problems! In a series of activities, your class will use data sets to calculate measurements, averages, means, and probabilities. The class completes worksheets and...
Curated OER
Measures of Center
In this statistics worksheet, students find mean, median, and mode for 3 problems. They find the mean of summarized data in 2 problems.


