Willow Tree
Line Graphs
Some data just doesn't follow a straight path. Learners use line graphs to represent data that changes over time. They use the graphs to analyze the data and make conclusions.
Curated OER
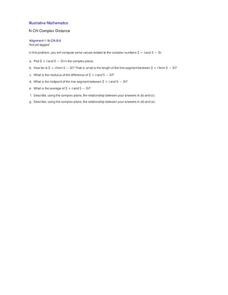
Complex Distance
Have learners graph complex numbers to gain a visual and mathematical understanding of the distance and the midpoint between two complex numbers. This lesson is short, but to the point, and addresses an important complex number concept....
Willow Tree
Mean, Median, and Mode
Statistics are more than just numbers—they can give you important information about a set of data. Pupils learn how to find the mean, median, and mode of a data set. They also find the next score to reach a desired mean.
Curated OER
Why Study Economic Downturns?
Research and connect America's current economic downturn with the 1929 Stock Market Crash and the Great Depression.
Physics Classroom
From a Feather to an Elephant
It is always a rush to drop objects from great heights, and with this physics experiment, class members will not be disappointed! They drop a single coffee filter from a balcony or table top, record the time it takes to reach the ground,...
Illustrative Mathematics
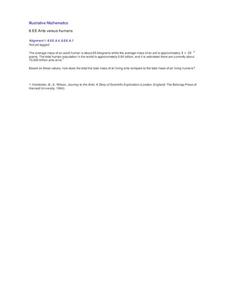
Ants Versus Humans
You would think that humans make up more mass than ants do on this planet, but think again, and this time by performing calculations. Middle schoolers use scientific notation to compute and compare the estimated total mass of all humans...
Balanced Assessment
Bumpy-Ness
Develop a new measure of the properties of an object. Scholars develop a definition and formula to measure the bumpy-ness of an object. They utilize their formulas to find the property for several spherical objects.
EngageNY
Constant Rates Revisited
Find the faster rate. The resource tasks the class to compare proportional relationships represented in different ways. Pupils find the slope of the proportional relationships to determine the constant rates. They then analyze the rates...
EngageNY
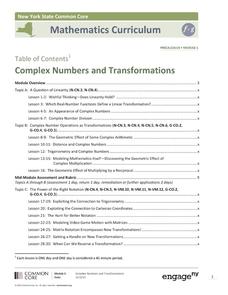
Complex Numbers and Transformations
Your learners combine their knowledge of real and imaginary numbers and matrices in an activity containing thirty lessons, two assessments (mid-module and end module), and their corresponding rubrics. Centered on complex numbers and...
NOAA
Ocean Zones
How can organisms light up in water? Bioluminescence is light produced in a chemical reaction that can occur in an organism's body. First, learners determine what happens to light/color as you move into the deep ocean. In groups, they...
Curated OER
Rising Gas Prices – Compounding and Inflation
Financial literacy skills and exponential models are connected by the compound interest formula in this task centered on inflation calculations. Collaborative learners get experience collecting data from the given websites and exploring...
Texas State Energy Conservation Office
Investigation: Automotive Emissions and the Greenhouse Effect
It is recommended that you conduct this fabulous experiment as a whole-class demonstration. Collect air samples from the environment, human exhalation, and car exhaust, then compare them for carbon dioxide content using bromthymol blue...
Curated OER
Worksheet 2: Graphs, Functions and Derivatives
In this math worksheet, students answer 7 questions having to do with graphing derivatives of functions, rectilinear motion, speed and distance.
Curated OER
Academic Grade 9 Assessment of Mathematics: Algebra I and Geometry
Test your class, or use this 12 page math packet as chapter review. They solve 21 multiple choice problems which require them to graph linear equations, find the volume of prisms and cones, find unknown angles, and determine...
Curated OER
Sunrise, Sunset
What locations on Earth get the longest number of hours of daylight in the summer? Hint: It's not the equator! Use real-world sunrise and sunset data to develop trigonometric models that can be used to estimate the number of hours of...
EngageNY
Bean Counting
Why do I have to do bean counting if I'm not going to become an accountant? The 24th installment of a 35-part module has the class conducting experiments using beans to collect data. Learners use exponential functions to model this...
Curated OER
Innocent or Guilty: A Lab on DNA Gel Electrophoresis
Students use the prelab as an introduction to the importance of DNA fingerprinting- a form of identification that us being accepted by both scientific and leagl experts. They prepare a gel for electrophoresis. DNA fragments, which have...
Curated OER
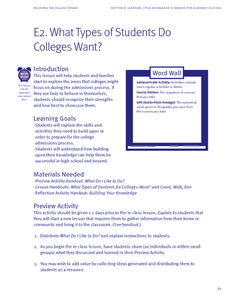
What Type of Students do Colleges Want?
What do college admissions teams look at when deciding who get's in and who doesn't? The class considers the types of classroom and extra curricular activities they participate in and how those might improve their chances at getting into...
Curated OER
US Population 1982-1988
Your algebra learners make predictions using the concepts of a linear model from real-life data given in table form. Learners analyze and discuss solutions without having to write a linear equation.
Mr. Waynes clas
Kinematics Objectives
Accelerate young physicists' learning with this collection of problem-solving worksheets. Starting off by teaching students to identify the given information and variables in physics problems, this resource goes on to challenge them with...
Shmoop
Box, Stem-Leaf, and Histogram
A helpful and versatile instructional activity requires young mathematicians to analyze data in order to create graphs and answer questions. Additionally, it prompts learners to find the mean, median, mode, and range of some of the data...
Mt. San Antonio Collage
Quiz 1: Functions, Domain and Range
Take the work out of worksheets and use these problems and worked-out answer key as a resource. The problems reinforce skills in domain and range, identifying graphs, and even and odd functions.
EngageNY
Distributions—Center, Shape, and Spread
Data starts to tell a story when it takes shape. Learners describe skewed and symmetric data. They then use the graphs to estimate mean and standard deviation.
EngageNY
Graphs of Simple Nonlinear Functions
Time to move on to nonlinear functions. Scholars create input/output tables and use these to graph simple nonlinear functions. They calculate rates of change to distinguish between linear and nonlinear functions.


