Virginia Department of Education
May I Have Fries with That?
Not all pie graphs are about pies. The class conducts a survey on favorite fast food categories in a lesson plan on data representation. Pupils use the results to create a circle graph.
Curated OER
Junk Food Math
Students use Skittles candies as they explore estimation and percentages. In this math lesson plan, students sort, count, and chart Skittles candies to learn about estimation and study percentages.
Curated OER
Making Graphs
Young scholars explore statistics by conducting class demographic surveys. In this graph making lesson, students identify the family members of each classmate, pets they own, and favorite activities. Young scholars organize their...
Curated OER
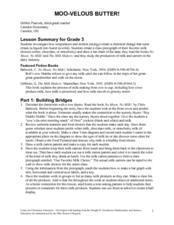
Moo-Velous Butter!
Third graders investigate how temperature and motion (energy) create a chemical change that turns cream ( a liquid) into butter (a solid). They create a class pictograph of their favorite mils choices (white, chocolate, or strawberry)...
Curated OER
M&M’s Math Worksheet
Who knew you could cover prediction, histograms, fractions, decimals, data collection, and averages (mean, median, and mode) all with a bag of M&M's®? Here's a fantastic set of worksheets to help you make candy a mathematical journey...
Curated OER
The Numbers Tell the Story
Students demonstrate how to gather and interpret statistical data. For this data analysis lesson, students search for statistics on the health effects of smoking and place the information into charts. Students create these charts online...
Curated OER
Statistics and Probablility
Statistics and Probability are all about collecting, organizing, and interpreting data. Young learners use previously collected data and construct a picture graph of the data on poster board. This stellar lesson should lead to...
Curated OER
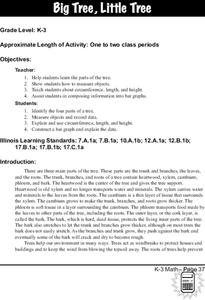
Trees
Students investigate the parts of a tree, measure its circumference and the length and width of its longest branch. The data is compiled and placed into a bar graph.
Curated OER
Creating a Graph
Students brainstorm favorite things to do during the summer. They survey classmates to collect data, arrange it in a chart, and create graphs using ClarisWorks.
K12 Reader
Displaying Data
It's important to learn how to display data to make the information easier for people to understand. A reading activity prompts kids to use context clues to answer five comprehension questions after reading several paragraphs about...
Curated OER
Blast the Fats
Students examine the fats found in foods. In this nutrition lesson, students identify the types and amounts of fats found in foods as they research food labels and the Internet. Students classify the fats and record their data.
Curated OER
Nine Examples for Tables, Pictographs, Mean. Median, and Mode
In this graphical representation of data and measures of central tendency worksheet, students calculate mean, median, and mode and answer questions related to graphs, tables, and pictographs.
Curated OER
Tally Time
Students create a tally chart. In this math and health lesson plan, students discuss healthy foods and create a tally chart showing the number of students who like to eat healthy foods.
Curated OER
A Thanksgiving Survey
Learners conduct a survey. In this math lesson, students design and conduct a survey about Thanksgiving foods. Learners display the collected data in a graph and use the graph to determine what food to serve for a Thanksgiving meal.
Curated OER
Skittles, Taste the Rainbow
Fifth graders learn and then demonstrate their knowledge of a bar and a circle graph using the classroom data. Students are given a pack of skittles candy. Students create a bar and circle graph indicating the results of the contents of...
Curated OER
Data From Interviews
Students create and conduct a survey about favorite foods, gather and represent the data, interpret data and make predictions to present to the class. They create and use interview questions to gather data. Pupils are explained that...
Curated OER
Graphs Abound
Students create a survey for their classmates to collect data on their favorite foods, eye color, pets or other categorical data. They compile the data from the survey in a table and then make a bar graph of each category using a web tool.
Curated OER
Testing for Vitamin C in different drinks and foods
Students develop an awareness of the use of Vitamin C in helping our environment and gain exposure to chemical procedures and techniques. Students analyze and interpret data by keeping a data sheet and making a bar graph.
Curated OER
Stick Out Your Tongue
Students explore their sense of taste and recognize good foods to eat. In this tasting lesson, students recognize that their tongue has taste buds for different types of tastes. Students create a bar graph showing their favorite taste (...
Curated OER
Skittle Graphing (Lesson Plan)
Learners discuss the uses of graphs. They use color candies to count and sort before designing graphs. They label the graph papers with appropriate titles and candy colors. They complete the graph bars, and discuss the results with a...
Curated OER
The Average Kid
Students determine the traits they have in common with other students in the class and create visual profiles of the "average" boy and the "average" girl.
Curated OER
Halloween Candy/ Sugar Content
Fourth graders examine the amount of sugar contained in Halloween candy by looking at nutritional labels from candy bars. They figure out ways to encourage people to reduce the amount of sugar they eat at this holiday. They look at the...
Curated OER
The Acetate Animal Hunt
Students determine which adaptations allow an organism to survive and reproduce in a certain environment. Students act as "predators" to pick up acetate discs "prey" scattered around the classroom. Students list the number found, the...
Curated OER
Finding Caterpillars
Students examine how animals protect themselves from predators and camouflage themselves. They participate in a simulation in which they locate red and green yarn "caterpillars," organize their data, and generate a bar graph using...


