Houghton Mifflin Harcourt
Use a Graph: Measure Fish
Something's fishy here! Use the bar graph provided to determine the length of each fish shown. Small cartoon fish make this an engaging worksheet for young learners. There are six questions provided.
Curated OER
Fast Food Survey Using Bar Graphs
Second graders create a bar graph to pictorically represent the data collected from a survey of students. They use Excel to electronically create the graphs and data tallies. They then interpret their data using sentences to explain.
Curated OER
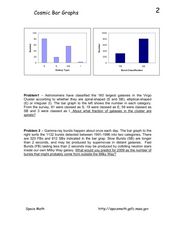
Cosmic Bar Graphs
In this cosmic bar graph worksheet, students solve 2 problems using given bar graphs that plot the number of galaxies vs. the galaxy type and the number of gamma-ray bursts vs. the burst classification. Students find the fraction of...
Baylor College
Living Things and Their Needs: The Math Link
Enrich your study of living things with these cross-curricular math activities. Following along with the story Tillena Lou's Day in the Sun, learners will practice addition and subtraction, learn how to measure volume and length,...
Curated OER
M&M's and the Scientific Method
Sixth graders explore the scientific method by conducting an in class experiment. In this scientific averages lesson, 6th graders discuss the concept of the scientific method, and define the different mathematical averages, mean, median...
Curated OER
Graph a Panther's Diet
Students examine the diet of panthers. In this interpreting data lesson, students collect data on the panther's diet and chart the data in bar and pie graphs.
Curated OER
Unit VII: Worksheet 4 - Energy
Energize your physics class with this energy exercise! Physics learners solve seven problems in which they calculate speed, velocity, or energy values for a variety of situations. This is a suitable homework assignment for high school...
ARKive
Handling Data: African Animal Maths
Handling and processing data is a big part of what real scientists do. Provide a way for your learners to explore graphs and data related to the animals that live on the African savannah. They begin their analysis by discussing what they...
Cornell University
Garden Math
Young scientists must put their math caps on and figure out what fraction of each flower is in a raised flower bed. They must problem solve to simplify the fractions, and then graph the amount of flowers that are in different flower beds.
Curated OER
U.S. Beach Attendance
In this bar graphs activity, students analyze the information about beach attendance over a period of 5 years. Students solve 3 story problems about the graph.
Science 4 Inquiry
Journey Through the Spheres of the Earth
Each of the Earth's spheres interacts with the other spheres in predictable ways. Young scientists explore these interactions through a hands-on activity, graphing, and watching a video. They summarize their knowledge in a video or...
Curated OER
Tulip Graphing
Students create a graph of tulip growth. In this data analysis lesson, students plant tulip bulbs and use graph paper to begin graphing data on the growth of the tulip.
Curated OER
MAISA and the REMC Association of Michigan
Students complete online research to study geography's impact on weather. In this geography and weather lesson, students research weather in their city for ten days using an online website. Students bookmark the site, enter data into a...
Curated OER
Parachute Drop
Learners will have fun creating a parachute to collect data with. They will construct the parachute in small groups, measure the materials, and create an observation sheet. Then they drop the parachute and make predictions about how long...
Curated OER
Go The Distance Car Construction
Students build and program a car to drive a specific challenge distance.They must at the end of the lesson, have the car that stops the closest to a challenge distance.
Science 4 Inquiry
Snakes in the Everglades
The Burmese python is on the loose ... and he's hungry! Illustrate the differences between causative and correlative relationships through an inquiry instructional activity. Pupils examine several sources of information to determine if...
Curated OER
Minerals
Students apply rules to compare and rank the hardness and softness of minerals. They perform a scratch test on four unknown mineral samples, read a bar graph that illustrates the comparative hardness and softness of four named minerals,...
Curated OER
Let the Rain Come Down!
Second graders construct a bar graph comparing local precipitation to that of the Yucatan. In this graphing lesson, 2nd graders will use conversions and problem solving strategies.
Curated OER
Toy Dissection Graph
Students explore simple machines and how they are made. They examine the parts of the simple machine and collect information about its parts. Using Excel, students create circle and bar graphs from the collected data.
Curated OER
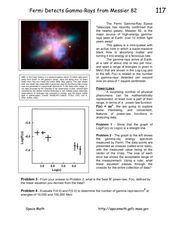
Fermi Detects Gamma-Rays from Messier
In this power law function worksheet, students use data from the Fermi Gamma-Ray Space telescope to apply the power law function to physical phenomena. Students use a graph to solve four problems.
Curated OER
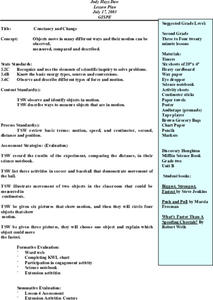
Constancy and Change
Second graders investigate how objects can move in different ways. They move in different ways across the room and develop a class list of movement words. Students also conduct a measuring motion experiment, create a bar graph for the...
Curated OER
Water: From Neglect to Respect
The goal of this collection of lessons is to make middle schoolers more aware of the ways in which they are dependent upon water to maintain their standard of living. Learners compare water use in Lesotho to water use in the United...
NASA
Newton Car
If a car gets heavier, it goes farther? By running an activity several times, teams experience Newton's Second Law of Motion. The teams vary the amount of weight they catapult off a wooden block car and record the distance the...
Curated OER
More Bait for Your Buck!
Students determine where to buy the heaviest earthworms as they study invertebrates. They create a double bar graph of the results of the weight data.


