Curated OER
Five Colors Bar Graph-Make a Bar Graph
Two worksheets are provided here that contain the same information but ask different questions. The first worksheet has the learner draw the graph themselves before answering the questions that follow, and the second worksheet has the...
Houghton Mifflin Harcourt
Use a Graph: Measure Fish
Something's fishy here! Use the bar graph provided to determine the length of each fish shown. Small cartoon fish make this an engaging worksheet for young learners. There are six questions provided.
Curated OER
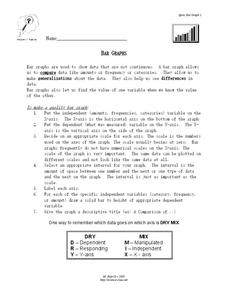
Bar Graphs
In this bar graph worksheet, students read about making quality bar graphs and they make a bar graph using given data. They answer 5 questions about their graph.
Curated OER
Olympic Bar Graphs
In this Olympic bar graph worksheet, students pick a sport from the 2004 Olympic games and find data from the Olympic web page. They graph the scores (times, distance, or speed) and the medals. They answer questions about the variables...
Curated OER
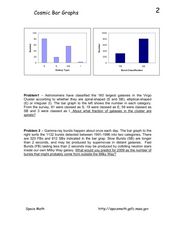
Cosmic Bar Graphs
In this cosmic bar graph worksheet, students solve 2 problems using given bar graphs that plot the number of galaxies vs. the galaxy type and the number of gamma-ray bursts vs. the burst classification. Students find the fraction of...
Curated OER
How Does Your Animal Move?---Class Bar Graph
Animals move in interesting ways! Get your young learners to examine various types of animal movement in this group graphing activity. Although directions are not explicit, it seems students are assigned an animal and categorize the...
Curated OER
Survey of Height
In this data collection worksheet, students survey the heights of their fellow classmates, organize their data in a data table, and create a bar graph from their data. Once bar graph is completed, students complete 2 short answer...
Curated OER
How Soluble Is It?
Is sugar more soluble than salt? Experiment with water and solubility with an elementary science activity. After interpreting data from a bar chart, fifth graders use different types of sugar to determine if the size of sugar particles...
Curated OER
What Does Your Bean Seed Look Like Today?-- Class Bar Graph
In this math/science worksheet, students who are already beginning to grow a bean seed record what it looks like on a given day. Detailed pictures of different growth stages are provided on the class graph.
Curated OER
Animal Runners
In this collecting data instructional activity, 4th graders use the data shown on how fast 6 animals can run to create a bar graph. Students follow the instructions on 3 directives for their bar graphs and answer 1 short answer question.
Curated OER
Endangered Species
In this geography worksheet, students identify how to manipulate data on a range of endangered species. They create a bar graph of endangered animals from Africa, Asia, Australia, North America, or South America. Students use a...
Curated OER
Deciding Which Type of Graph is Appropriate
In this graphing instructional activity, students read about line, bar, and pie graphs and then determine which graph is the best way to express data results. This instructional activity has 3 short answer questions.
Curated OER
Human Population Growth
In this human population growth worksheet, students create a graph of human population growth and predict future growth using the data given in a chart. Students identify factors that affect population growth.
Curated OER
Which Kind of Weather Do You Like Best? -- Class Bar Graph
In this math worksheet, students generate a class bar graph. Classmates are surveyed about favorite weather: sunny, rainy, snowy, cloudy or windy. Results are displayed on a bar graph.
Curated OER
Bluebird Eggs in Nestbox chart
In this bluebird eggs worksheet, students fill out the chart which resembles a bar graph on how many eggs each bluebird has and answer short answer questions. Students answer 5 questions.
Curated OER
Animal Habitat Bar Graph
In this graphing worksheet, students examine a prepared bar graph and record which habitat their chosen animal lives in: desert, city, forest, ocean, prairie, or fresh water. There are no directions but it appears that a class could use...
Curated OER
How Many Days Did It Take for Your Bean Seed To Germinate?--class Bar Graph
In this math/science worksheet, students collaborate as a class to create a bar graph which displays the germination time for bean seeds. Students survey their classmates and plot results on a graph.
Curated OER
Organizing Data
In this data worksheet, students convert measurements to significant notation and determine the number of significant digits. This worksheet has 4 fill in the blank and 2 short answer questions.
Curated OER
Graphing - Length
In this graphing worksheet, students create a bar graph showing the approximate maximum length of 12 different types of fish.
Curated OER
Unit VII Energy: WS 3a Energy Transfer and Storage
Here is a nifty worksheet on energy transfer. Physics fanatics analyze a diagram and state whether or not friction is involved. They sketch bar graphs and draw energy flow diagrams for each system as well. Circular motion, movement up...
Curated OER
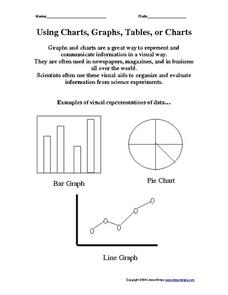
Using Charts, Graphs, Tables, or Charts
In this charts, graphs and tables learning exercise, students view 3 different types of visual representations of data, make a list of 20 items and decide how the items can best be put together in groups to make a graph, chart or table....
CPO Science
Science Worksheets
If you need an array of worksheets to augment your science lessons, peruse a collection of assignments that is sure to fit your needs. With topics such as metric conversion, the scientific method, textbook features, research skills,...
Curated OER
Evaporation Experiment- Desert Science Graph
In this science worksheet, students make a bar graph about desert evaporation. The directions say to use the "data from your recording data page" to display information on the graph.
Curated OER
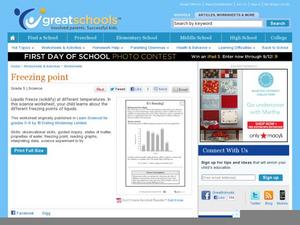
It's Freezing!
Here is a good worksheet for 5th grade scientists. In it, they look at a bar graph that shows the freezing point for a variety of liquids. Then, they are given a scenario of a certain liquid melting and freezing, and must determine which...
Other popular searches
- Skittles Bar Graph
- Double Bar Graphs
- Bar Graphs Pictographs
- Histogram and Bar Graph
- Bar Graphs and Histograms
- Bar Graph Problem Solving
- Favorite Food Bar Graph
- Bar Graphs Histograms
- Interpreting Bar Graphs
- Bar Graphs for Birthdays
- Bar Graph Worksheet
- Bar Graphs and Charts


