Willow Tree
Bar Graphs
Circles, lines, dots, boxes: graphs come in all shapes in sizes. Scholars learn how to make a bar graph using univariate data. They also analyze data using those bar graphs.
Houghton Mifflin Harcourt
Nature Walk: English Language Development Lessons (Theme 2)
Walking in nature is the theme of a unit designed to support English language development lessons. Scholars look, write, speak, and move to explore topics such as camping, woodland animals, instruments,...
Willow Tree
Histograms and Venn Diagrams
There are many different options for graphing data, which can be overwhelming even for experienced mathematcians. This time, the focus is on histograms and Venn diagrams that highlight the frequency of a range of data and overlap of...
CPO Science
Science Worksheets
If you need an array of worksheets to augment your science lessons, peruse a collection of assignments that is sure to fit your needs. With topics such as metric conversion, the scientific method, textbook features, research skills,...
Del Mar College
Finding the Domain
Domain to a math teacher makes perfect sense, but it can seem like gibberish to high schoolers. As it is laid out in clear terms, domain is introduced and explained among all types of functions throughout the handout. The first three...
It's About Time
Volcanic Hazards: Airborne Debris
Pupils interpret maps and graph data related to volcanic ash. Then they analyze the importance of wind speed and the dangers of the ash to both life, air temperature, and technology.
Code.org
Making Data Visualizations
Relax ... now visualize the data. Introduce pupils to creating charts from a single data set. Using chart tools included in spreadsheet programs class members create data visualizations that display data. The...
Khan Academy
Khan Academy: Bar Graphs Review
Bar graphs are a nice way to visualize categorical data. This article reviews how to create and read bar graphs.
Wolfram Research
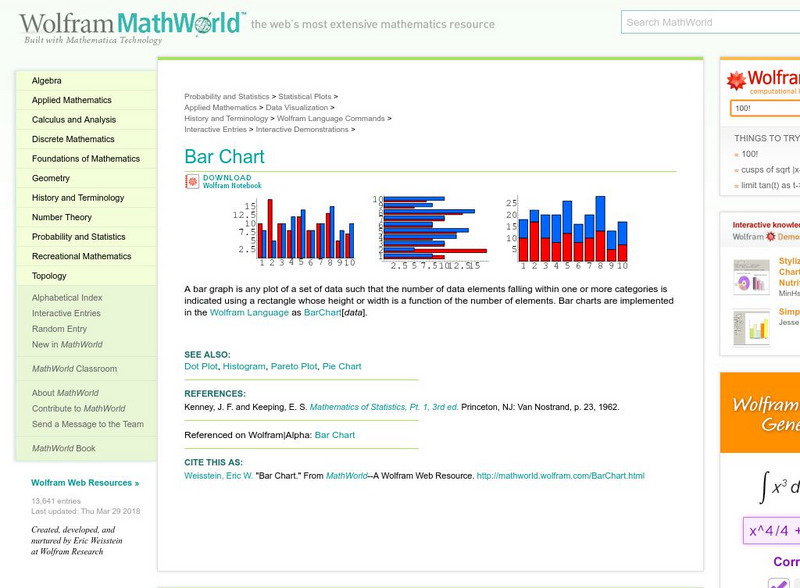
Wolfram Math World: Bar Chart
MathWorld offers a definition and example of the math term, "bar chart."
Varsity Tutors
Varsity Tutors: Hotmath: Algebra Review: Bar Graph
Find a quick, concise explanation of a bar graph. An example is given.
University of Illinois
University of Illinois: Bar Graphs
Two bar graph examples are shown and explained at this website. You can learn what kind of data is best represented using a bar graph.
Math Is Fun
Math Is Fun: Histograms
Explains, with examples, what a histogram is, how it differs from a bar graph, and how to interpret one. Includes a set of practice questions.
Colorado State University
Colorado State Writing Center: Charts
The use of charts and graphs can improve your presentations, whether on paper or as visual aids. Here you can read about how to create line, column, bar, pie graphs, and scatterplots. Just follow the links to their respective pages.
The World Bank
World Bank: Poulation, Total
This site from the World Bank provides data on population for most of the countries of the world in 2020, and shows the change in the rate from 1960 to 2020. Statistics are presented in a chart, line graph, bar graph, and map. The data...
The World Bank
World Bank: Mortality Rate, Infant (Per 1,000 Live Births)
This site from the World Bank provides data on infant mortality for most of the countries of the world in 2020, and shows the change in the rate from 1960 to 2020. Statistics are presented in a chart, line graph, bar graph, and map. The...
Pew Research Center
Pew Social and Demographic Trends: Migration Flows in the United States
The Pew Hispanic Research Center details the migration flows of the United States. Breaks down U.S. migration patterns from the last 20 years. Scroll mouse over map to see the regional migration throughout the years. View a map which...
US Geological Survey
Usgs: Water Science for Schools Uses of Saline Water
This U.S. Geological Survey website explains a variety of uses for saline water. Pie graphs and bar graphs are used to illustrate the various uses. Click Home to access the site in Spanish.
Purple Math
Purplemath: Stem and Leaf Plots
Explains how to create a stem-and-leaf plot from a data set. Demonstrates how to format a clear stem-and-leaf plot.
Other
Stat Soft: Statistics Glossary
Dozens of statistical terms are defined and illustrated in this glossary.
Other popular searches
- Skittles Bar Graph
- Double Bar Graphs
- Bar Graphs Pictographs
- Histogram and Bar Graph
- Bar Graphs and Histograms
- Bar Graph Problem Solving
- Favorite Food Bar Graph
- Bar Graphs Histograms
- Interpreting Bar Graphs
- Bar Graphs for Birthdays
- Bar Graph Worksheet
- Bar Graphs and Charts


