Inside Mathematics
Scatter Diagram
It is positive that how one performs on the first test relates to their performance on the second test. The three-question assessment has class members read and analyze a scatter plot of test scores. They must determine whether...
Kenan Fellows
Lego Thinking and Building
Run a simulated airplane manufacturing plant with your pupils as the builders! Learners build Lego airplane models and collect data on the rate of production, comparing the number produced to the number defective. Using linear...
Teach Engineering
The Challenge Question
A research position becomes a modeling job. The introductory lesson in a series of nine presents the challenge of analyzing a set of bivariate data. The class brainstorms what the data may represent. Pupils must decide what is needed to...
Statistics Education Web
The United States of Obesity
Mississippi has both the highest obesity and poverty rate in the US. Does the rest of the data show a correlation between the poverty and obesity rate in a state? Learners tackle this question as they practice their skills of regression....
Rochester Institute of Technology
Skateboard Performance Testing
Perform an activity on performance testing with a instructional activity focused on the purpose of wheel bearings on skateboards. Learners conduct performance testing on a skateboard to collect and interpret data.
Radford University
Sleep and Teen Obesity: Is there a Correlation?
Does the number of calories you eat affect the total time you sleep? Young mathematicians tackle this question by collecting their own data and making comparisons between others in the class through building scatter plots and regression...
American Statistical Association
EllipSeeIt: Visualizing Strength and Direction of Correlation
Seeing is believing. Given several bivariate data sets, learners make scatter plots using the online SeeIt program to visualize the correlation. To get a more complete picture of the topic, they research their own data set and perform an...
Mathematics Assessment Project
College and Career Readiness Mathematics Test C2
Scholars apply knowledge learned over their high school math courses in order to determine their college readiness. The 20-page resource emphasizes applied problem solving.
EngageNY
Analyzing Data Collected on Two Variables
Assign an interactive poster activity to assess your class's knowledge and skill concerning data analysis. The teacher reference provides solid questions to ask individuals or groups as they complete their posters.
Learning to Give
Teaching Playwriting in Schools
The world is a stage, and so is your classroom! Hone the skills of the next generation of Tony® award winners with a set of exercises, reference pages, writing prompts, and excerpts from famous plays.
Curated OER
Celsius to Fahrenheit
Students convert degrees between two different units. In this algebra lesson, students graph linear equations and identify the line of best fit. They use their line of best fit to make predictions given a set of data.
Curated OER
Traveling Through the Solar System
Students use calculator and non-calculator methods for analyzing data. They apply data collection and analysis in a study of mass and weight. Students enhance and apply the concept of line of best fit. They master graphing in a plane,...
Center of Excellence for Science and Mathematics Education
A Sick Astronaut
Aspiring astronauts graph, interpret, and analyze data. They investigate the relationship between two variables in a problem situation. Using both graphic and symbolic representations they will grasp the concept of line of best fit to...
Curated OER
Spaghetti Graphs
Students work in pairs to test the strength of spaghetti strands. They collect and graph data to determine a line of best fit. Students create a linear equation to interpret their data. Based on the data collected, students predict...
Creative Chemistry
A Simple Thermoetric Titration
In this thermometric titration activity, learners investigate the temperature changes when an acid neutralizes an alkali. High schoolers graph their results from the titration and draw the two best-fit lines on their graph. Where the...
Curated OER
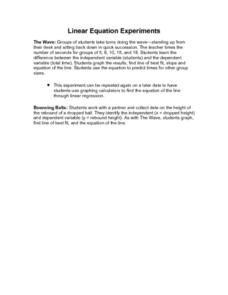
Linear Equation Experiments
In this linear equation learning exercise, students solve and complete 2 different experiments that include using linear equations. First, they determine the difference between independent and dependent variables. Then, students graph...
Curated OER
Exploring Linear Equations And Scatter Plots - Chapter 5 Review
Students complete rolling stocks experiment, and collect and enter data on the computer. They enter data on graphing calculators, complete scatter plot by hand with line of best fit, and discuss different graphing methods.
Curated OER
Be ready for your English exam
In this reading worksheet, students read each line and at the end of the line they write "correct" if the line is correct and if there is a word that should not be there, they write that word. Students complete this for 15 lines and then...
Curated OER
Homonyms Worksheet 1
For this grammar worksheet, students underline the appropriate word in parentheses that best fits twenty-one sentences. Students check to make sure each sentence is grammatically correct.
Curated OER
Strike a Pose: Modeling in the Real World (There's Nothing to It!)
Adjust this lesson to fit either beginning or more advanced learners. Build a scatter plot, determine appropriate model (linear, quadratic, exponential), and then extend to evaluate the model with residuals. This problem uses real-world...
Curated OER
SAT Problem Solving Practice Test
In this problem solving practice test, students select the best answer from 4 choices to ten questions. Questions are word problems and cover a variety of topics.
Curated OER
Exploring Diameter and Circumference
Learn how to identify the diameter and circumference of a circle. Then, collect data on a circle and relate it to the diameter and circumference of a circle. Last, plot data and find the line of best fit.
Curated OER
Designing an Earthquake-resistant Structure
Students attempt to design and build the most stable "earthquke resistant" structure. They create model buildings and test them on a shake table to see which design holds up the best.
Curated OER
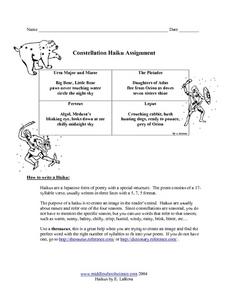
Constellation Haiku Assignment
In this constellation haiku worksheet, students create a poem with a 17-syllable verse that paints a picture about a constellation. They use words that refer to the seasons since constellations are seasonal. Students can use a thesaurus...
Other popular searches
- Line of Best Fit
- Best Fit Lines
- Lines of Best Fit
- Best Fitting Line
- Math Best Fit Line
- Algebra Line of Best Fit
- Best Fit Line Worksheets
- Correlation Best Fit Lines


